Comparative Study
. 2002 Jul 1;21(13):3434-42.
doi: 10.1093/emboj/cdf340.

An embryonic/fetal beta-type globin gene repressor contains a nuclear receptor TR2/TR4 heterodimer

Affiliations
Comparative Study

An embryonic/fetal beta-type globin gene repressor contains a nuclear receptor TR2/TR4 heterodimer

Osamu Tanabe et al. EMBO J. .

Abstract

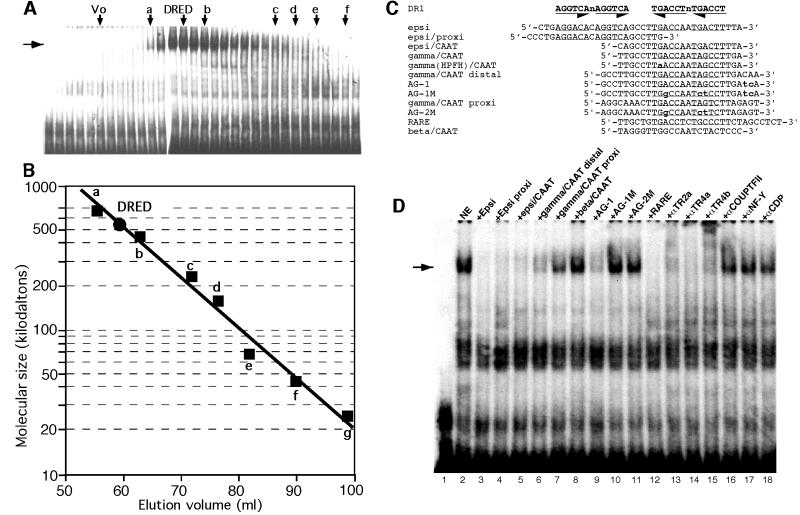
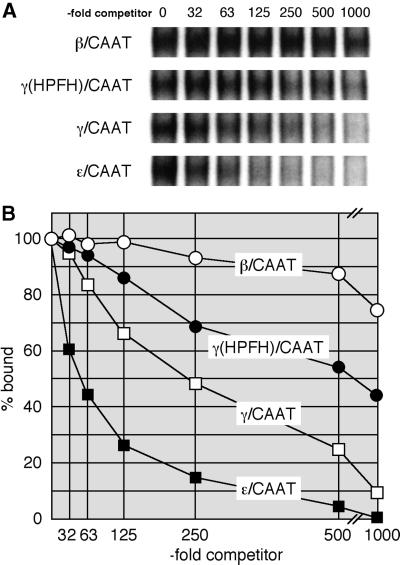
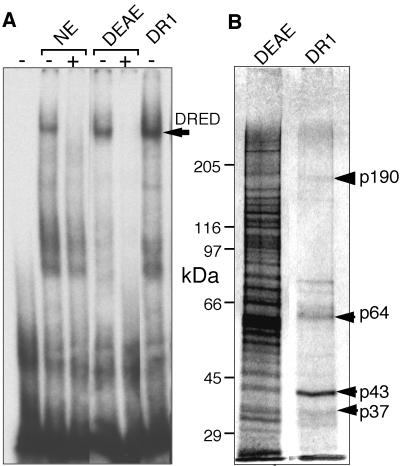
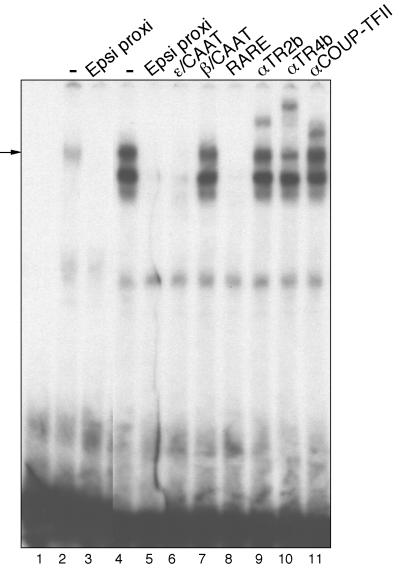
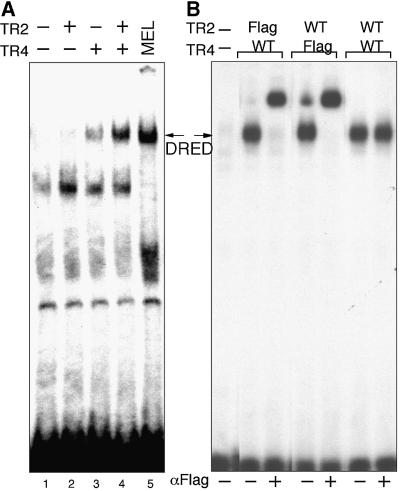
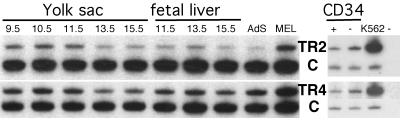
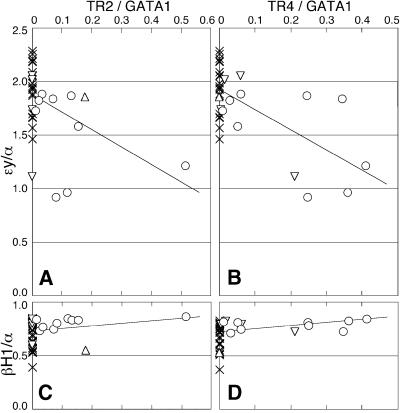
We recently described an erythroid epsilon-globin gene repressor activity, which we named DRED (direct repeat erythroid-definitive). We show that DRED binds with high affinity to DR1 sites in the human embryonic (epsilon-) and fetal (gamma-) globin gene promoters, but the adult beta-globin promoter has no DR1 element. DRED is a 540 kDa complex; sequence determination showed that it contains the nuclear orphan receptors TR2 and TR4. TR2 and TR4 form a heterodimer that binds to the epsilon and gamma promoter DR1 sites. One mutation in a DR1 site causes elevated gamma-globin transcription in human HPFH (hereditary persistence of fetal hemoglobin) syndrome, and we show that this mutation reduces TR2/TR4 binding in vitro. The two receptor mRNAs are expressed at all stages of murine and human erythropoiesis; their forced transgenic expression reduces endogenous embryonic epsilony-globin transcription. These data suggest that TR2/TR4 forms the core of a larger DRED complex that represses embryonic and fetal globin transcription in definitive erythroid cells, and therefore that inhibition of its activity might be an attractive intervention point for treating sickle cell anemia.


Figures

None
Fig. 1. DNA binding characteristics and specificity of DRED. (A) MEL cell nuclear extracts were separated by filtration on a Superdex 200 column (Materials and methods) relative to known molecular mass standards: a, thyroglobulin (669 kDa); b, ferritin (440 kDa); c, catalase (232 kDa); d, aldolase (158 kDa); e, albumin (67 kDa); f, ovalbumin (43 kDa); and g, chymotrypsinogen A (25 kDa). The peak of DRED EMSA activity (horizontal arrow) elutes coincident with a predicted molecular mass of 540 kDa (B). (C) Oligonucleotides used in EMSA and DRED purification. Unless otherwise stated, each of the oligonucleotides referred to in the text were blunt ended, double-stranded DNAs. The top line shows the position of two inverted DR1 consensus sequence elements aligned above the two DR1 elements in the ε-globin gene promoter (epsi), while the remaining oligonucleotides are described in the text. The Greek –117 Aγ HPFH point mutation [gamma(HPFH)/CAAT] is indicated in lower case bold, as are all of the oligonucleotides that differ from parental (wild type) sequences. Genuine or postulated (test) DR1 elements are underlined. (D) EMSA was performed as described in Materials and methods using radiolabeled ‘epsi’ bearing two DR1 elements (Tanimoto et al., 2000) as the probe. MEL cell nuclear extract (5 µg) was incubated with a 200-fold molar excess of indicated competing oligonucleotides before the addition of radiolabeled probe.
None
Fig. 2. Competitive EMSA analysis of DRED binding to CAAT boxes from the β-like globin gene promoters. (A) Equilibrium competition EMSA was performed as described in Materials and methods using radiolabeled ‘epsi’ as probe. A 32-, 63-, 125-, 250-, 500- or 1000-fold molar excess of competing oligonucleotide [β/CAAT, γ(HPFH)/CAAT, γ/CAAT or ε/CAAT] was incubated with MEL cell nuclear extract before the addition of the radiolabeled probe. (B) The DRED EMSA bands shown in (A) were quantified on a phosphorimager and the relative amount of complex remaining at each competitor concentration was plotted relative to the same sample with no added competitor (set at 100%). The values represent the average of two independent experiments.
None
Fig. 3. DRED purification. The DRED complex was purified as described in Materials and methods. (A) EMSA was performed by incubating crude nuclear extract (NE; 2 µg of protein), the pooled DEAE Sepharose fraction (DEAE, 0.2 µg, 10 µl) or the peak fraction from the DNA sequence affinity column (DR1, 10 µl) with radiolabeled ‘epsi’ probe with (+) or without (–) preincubation with excess unlabeled probe. The arrow indicates the mobility of the DRED complex. (B) Proteins recovered in the peaks of the DEAE Sepharose and DR1 sequence affinity fractions (40 µl each) were separated by SDS–PAGE and silver-staining.
None
Fig. 4. Embryonic erythroid cells contain multiple DR1 binding proteins. MEL (lanes 2 and 3) or K562 (lanes 4–11) nuclear extracts (5 µg of protein each) were incubated with the indicated competing oligonucleotides (Figure 1C) or antibodies before the addition of radio labeled ‘epsi proxi’ probe. See the text and Figure 1D legend for details.
None
Fig. 5. Reconstitution of DRED binding by expression of TR2 and TR4 in tissue culture cells. (A) TR2 or TR4 expression plasmids were transiently transfected into QT6 quail fibroblasts. Two days after transfection, nuclear extracts were prepared and subjected to EMSA using the ‘epsi proxi’ probe. MEL cell nuclear extract was used as a control. (B) Amino/Flag-epitope-tagged or wild-type TR2 or TR4 expression plasmids were transiently transfected into 293T cells. Two days after transfection, nuclear extracts were prepared and subjected to EMSA with the ‘epsi proxi’ probe. Nuclear extracts were preincubated with anti-Flag monoclonal antibody (+) or not (–), before the addition of the radiolabeled ‘epsi proxi’ probe. The arrows indicate the migration position of authentic DRED.
None
Fig. 6. TR2 and TR4 are both expressed throughout murine and human hematopoiesis. Total RNA was prepared from mouse tissues or from cell lines, and used for cDNA synthesis (see Materials and methods). TR2 (top panels) and TR4 (bottom panels) transcript abundances were normalized to the expression levels of co-amplified mouse HPRT mRNA (C, left panels) or human ribosomal protein S14 mRNA (C, right panels). RT–PCR was performed with primers corresponding to TR2 (top panels) or TR4 (bottom panels). cDNAs used for the reactions corresponded to the cell types shown above each lane. For the human erythroid cells, total RNA was prepared from fractionated human bone marrow cells (CD34+ or CD34–) and was used for cDNA synthesis. RNAs recovered from the murine definitive erythroid cell line MEL or the human primitive erythroid cell line K562 were used as the positive controls.
None
Fig. 7. TR2 and TR4 erythroid-restricted expression represses εy-globin transcription. Transgenic founder embryos co-injected with TR2 and TR4 cDNAs transcriptionally directed by GATA1-HRD (see text) were analyzed for accumulation of transgenic TR2 or TR4 mRNAs, as well as for εy- and βH1-globin mRNAs in E10.5 yolk sacs by semi-quantitative RT–PCR. TR2 and TR4 mRNA levels were normalized to GATA-1 mRNA abundance, and εy- and βH1-globin mRNA levels were normalized to endogenous α-globin mRNA abundance (see text). Symbols: crosses, embryos expressing no transgene (n = 25); open circles, embryos expressing both TR2 and TR4 (n = 9); triangles, embryos expressing only TR2 (n = 1); inverted triangles, embryos expressing only TR4 (n = 4). Each of the lines was drawn by the least squares method. Analyzed by Pearson’s correlation coefficient test, the correlation between TR2 or TR4 expression and diminished εy abundance was statistically significant (A and B), while there was no significant correlation between expression of TR2 or TR4 and βH1 (C and D).

Similar articles

Cited by

References

    1. Ayer D.E., Lawrence,Q.A. and Eisenman,R.N. (1995) Mad-Max transcriptional repression is mediated by ternary complex formation with mammalian homologs of yeast repressor Sin3. Cell, 80, 767–776. - PubMed
    1. Barberis A., Superti-Furga,G. and Busslinger,M. (1987) Mutually exclusive interaction of the CCAAT-binding factor and of a displacement protein with overlapping sequences of a histone promoter. Cell, 50, 347–359. - PubMed
    1. Behe M.J. and Englander,S.W. (1979) Mixed gelation theory. Kinetics, equilibrium and gel incorporation in sickle hemoglobin mixtures. J. Mol. Biol., 133, 137–160. - PubMed
    1. Chang C. and Kokontis,J. (1988) Identification of a new member of the steroid receptor super-family by cloning and sequence analysis. Biochem. Biophys. Res. Commun., 155, 971–977. - PubMed
    1. Chang C., Da Silva,S.L., Ideta,R., Lee,Y., Yeh,S. and Burbach,J.P. (1994) Human and rat TR4 orphan receptors specify a subclass of the steroid receptor superfamily. Proc. Natl Acad. Sci. USA, 91, 6040–6044. - PMC - PubMed

Publication types

MeSH terms