. 2002 Jul 9;99(14):9231-6.
doi: 10.1073/pnas.152294399. Epub 2002 Jul 1.

Polyvalent cation receptor proteins (CaRs) are salinity sensors in fish

Affiliations

Polyvalent cation receptor proteins (CaRs) are salinity sensors in fish

J Nearing et al. Proc Natl Acad Sci U S A. .

Abstract

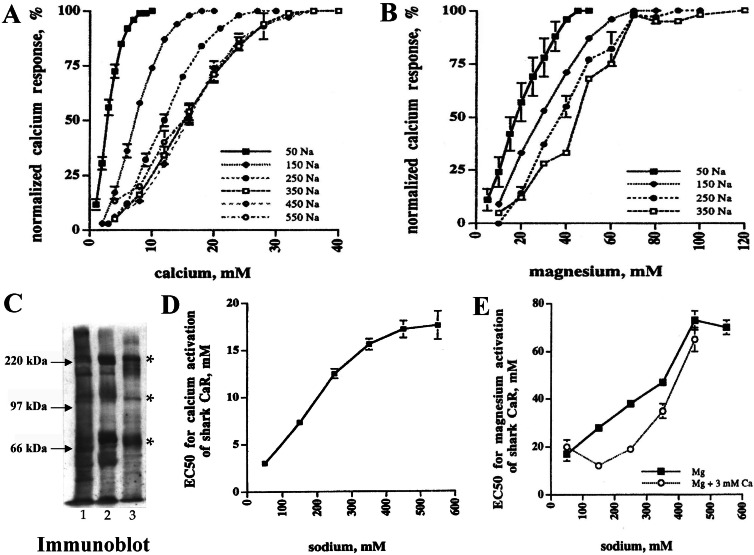
To determine whether calcium polyvalent cation-sensing receptors (CaRs) are salinity sensors in fish, we used a homology-based cloning strategy to isolate a 4.1-kb cDNA encoding a 1,027-aa dogfish shark (Squalus acanthias) kidney CaR. Expression studies in human embryonic kidney cells reveal that shark kidney senses combinations of Ca(2+), Mg(2+), and Na(+) ions at concentrations present in seawater and kidney tubules. Shark kidney is expressed in multiple shark osmoregulatory organs, including specific tubules of the kidney, rectal gland, stomach, intestine, olfactory lamellae, gill, and brain. Reverse transcriptase-PCR amplification using specific primers in two teleost fish, winter flounder (Pleuronectes americanus) and Atlantic salmon (Salmo salar), reveals a similar pattern of CaR tissue expression. Exposure of the lumen of winter flounder urinary bladder to the CaR agonists, Gd(3+) and neomycin, reversibly inhibit volume transport, which is important for euryhaline teleost survival in seawater. Within 24-72 hr after transfer of freshwater-adapted Atlantic salmon to seawater, there are increases in their plasma Ca(2+), Mg(2+), and Na(+) that likely serve as a signal for internal CaRs, i.e., brain, to sense alterations in salinity in the surrounding water. We conclude that CaRs act as salinity sensors in both teleost and elasmobranch fish. Their tissue expression patterns in fish provide insights into CaR functions in terrestrial animals including humans.


Figures

Figure 1
Figure 1
Comparison of SKCaR (S), RaKCaR (R), Fugu CaR (F), and two RT-PCR teleost CaR products from winter flounder (W) or Atlantic salmon (A) tissues. Amino acids identical to SKCaR are shaded, and locations of the seven-transmembrane regions are boxed. Bold underlined amino acids indicate the location of the dSK-F3 and dSK-R4 primers used to amplify 656-nt PCR products.
Figure 2
Figure 2
SKCaR is expressed in a variety of shark tissues. (A) Blot of kidney poly(A)+ RNA showing 7- and 4-kb SKCaR transcripts; gel top (GT) and dye front (DF). Immunocytochemistry with anti-SKCaR (B and DH), anti-4641 (C), and anti-Na+K+ ATPase (I). Arrows point to specific labeling. (B) Kidney LDT apical surface labeling (red-brown color) (× 1,390). (C) Kidney LDT and collecting duct (CD) (×1,390). (D) Rectal gland central canal (CC) and parenchyma (×265). (E) Intestinal apical (A) surfaces and blood or lymph vessels (v) (×1,390). (F) Stomach epithelial cells (me) and crypts (c) (×1,030). (G) Olfactory epithelial cells (A arrows) (×230). (H and I) Gill tissue (chloride cells show specific labeling) (×180). For various controls see Fig. 6.
Figure 3
Figure 3
Ionic pharmacology of SKCaR in HEK cells. (A) SKCaR sensitivity to extracellular Ca2+ concentrations at different NaCl concentrations. (B) SKCaR sensitivity to extracellular Mg2+ concentrations at different NaCl concentrations. (C) HEK–SKCaR cells (lane 3) express SKCaR proteins (*) that comigrate with bands in shark kidney (lane 1) and rectal gland (lane 2). (D) Modulation of Ca2+ EC50 by NaCl. (E) Modulation of Mg2+ EC50 by NaCl that is enhanced by 3 mM Ca2+.
Figure 4
Figure 4
Winter flounder tissues contain CaRs including a 4.1-kb CaR in urinary bladder that modulates NCC-mediated NaCl-coupled water reabsorption. (A) Immunocytochemistry with anti-SKCaR (A) or 4641 (Fig. 7) antisera reveals CaR in bladder epithelial cells (arrows) (×620). (B) Anti-SKCaR staining of stomach cells (arrows) (×750). (C) Same as B with preimmune antiserum. (D) Immunoblot of stomach homogenate using anti-4641 antiserum in the absence (A) or presence (A+P) of blocking peptide showing specific 230-kDa band. (E) Southern blot of RT-PCR of winter flounder: lane 1, urinary bladder; lane 2, kidney; lane 3, intestine; lane 4, stomach; lane 5, liver; lane 6, brain; lane 7, water blank, and lane 8, positive control. (F) RNA blot of 5 μg poly(A)+ RNA/lane from flounder heart (lane 1), liver (lane 2), spleen (lane 3), and urinary bladder (lane 4) probed first with 32P-RaKCaR and exposed for 10 days (Left), then stripped and reprobed with 32P-NCC cDNA (17) and exposed for 1 hr. Representative of five experiments. (G) Effects on Jv of separate additions of 100 μM hydrochlorothiazide (HCTZ), 100 μM Gd3+, or 200 μM Neo to solution bathing mucosal surface (n = 5 each). (H) Jv inhibition by Gd3+ and Neo. Each data point is mean of at least five independent Jv determinations.
Figure 5
Figure 5
CaRs in Atlantic salmon tissues may sense increases in external and plasma Ca2+, Mg2+, and NaCl that accompany transfer from freshwater to seawater. (A) Ethidium bromide (EtBr)-stained gel and corresponding Southern blot (SB) of RT-PCR products in: lane 1, gill; lane 2, olfactory lamellae; lane 3, urinary bladder; lane 4, kidney; lane 5, intestine; lane 6, stomach; lane 7, liver; lane 8, brain; lane 9, water blank; and lane 10, positive control. Anti-SKCaR immunostaining (arrows) of hindbrain neurons (B) containing CaRs (×840) and gill chloride cells (arrows) and mucous cells (arrowhead) (C) (×175) (also anti-4641 staining of chloride cells; see Fig. 8). (D) Chloride cells stained with anti-Na+K+ATPase antiserum (arrows) (×175). (E) Plasma Ca2+ and Mg2+ and corresponding Na+ concentrations (F) of freshwater-adapted fish (average weight 30 g) transferred to seawater at time 0 and samples obtained at intervals indicated. Each data point is the mean ± SD of at least four independent determinations.

Similar articles

Cited by

References

    1. Brown E M, Pollack M D, Seidman C E, Seidman J G, Chou Y-H W, Riccardi D, Hebert S C. N Engl J Med. 1995;333:234–240. - PubMed
    1. Rogers K V, Dunn C K, Hebert S C, Brown E M. Brain Res. 1997;744:47–56. - PubMed
    1. Chattopadhyay N, Cheng I, Rogers K, Riccardi D, Hall A, Diaz R, Hebert S C, Soybel D I, Brown E M. Am J Physiol. 1998;274:G122–G130. - PubMed
    1. Quinn S J, Kifor O, Trivedi S, Diaz R, Vassilev P, Brown E. J Biol Chem. 1998;273:19579–19586. - PubMed
    1. Baum M A, Harris H W. Am J Med Sci. 1998;316:321–328. - PubMed

MeSH terms

Associated data

LinkOut - more resources