

The limit fold change model: a practical approach for selecting differentially expressed genes from microarray data
- PMID: 12095422
- PMCID: PMC117238
- DOI: 10.1186/1471-2105-3-17
The limit fold change model: a practical approach for selecting differentially expressed genes from microarray data
Abstract
Background: The biomedical community is developing new methods of data analysis to more efficiently process the massive data sets produced by microarray experiments. Systematic and global mathematical approaches that can be readily applied to a large number of experimental designs become fundamental to correctly handle the otherwise overwhelming data sets.
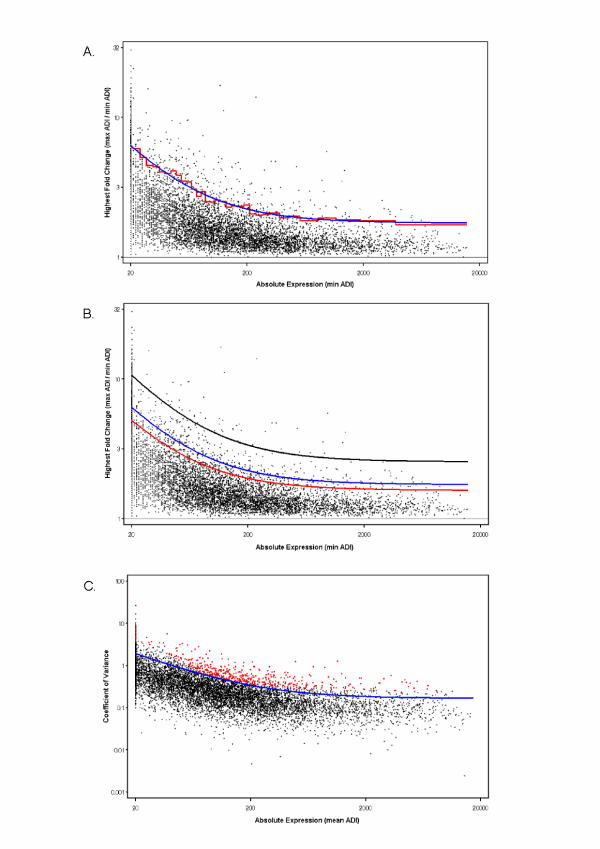
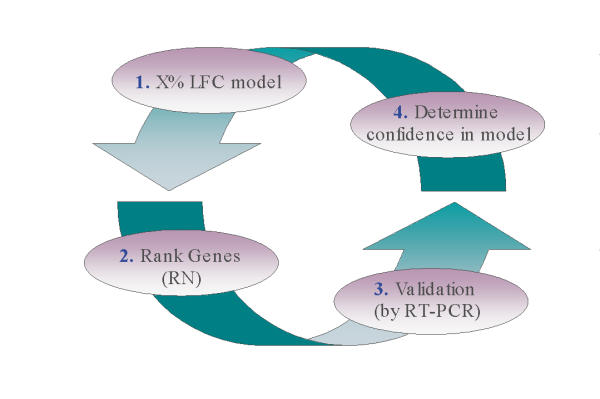
Results: The gene selection model presented herein is based on the observation that: (1) variance of gene expression is a function of absolute expression; (2) one can model this relationship in order to set an appropriate lower fold change limit of significance; and (3) this relationship defines a function that can be used to select differentially expressed genes. The model first evaluates fold change (FC) across the entire range of absolute expression levels for any number of experimental conditions. Genes are systematically binned, and those genes within the top X% of highest FCs for each bin are evaluated both with and without the use of replicates. A function is fitted through the top X% of each bin, thereby defining a limit fold change. All genes selected by the 5% FC model lie above measurement variability using a within standard deviation (SDwithin) confidence level of 99.9%. Real time-PCR (RT-PCR) analysis demonstrated 85.7% concordance with microarray data selected by the limit function.
Conclusion: The FC model can confidently select differentially expressed genes as corroborated by variance data and RT-PCR. The simplicity of the overall process permits selecting model limits that best describe experimental data by extracting information on gene expression patterns across the range of expression levels. Genes selected by this process can be consistently compared between experiments and enables the user to globally extract information with a high degree of confidence.
Figures
References
-
- Ptashne M, Gann A. Genes & Signals. Cold Spring Harbor, New York: Cold Spring Harbor Laboratory Press. 2002.
-
- Ekins RP. Ligand assays: from electrophoresis to miniaturized microarrays. Clin Chem. 1998;44:2015–2030. - PubMed
Publication types
MeSH terms
Substances
LinkOut - more resources
Full Text Sources
Other Literature Sources
Molecular Biology Databases
