. 2002 Jul 1;542(Pt 1):119-30.
doi: 10.1113/jphysiol.2002.017301.

KCNE4 is an inhibitory subunit to the KCNQ1 channel

Affiliations

KCNE4 is an inhibitory subunit to the KCNQ1 channel

Morten Grunnet et al. J Physiol. .

Abstract

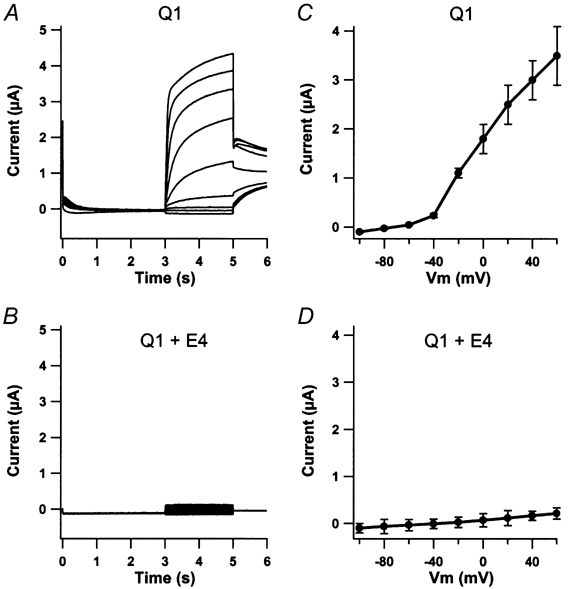
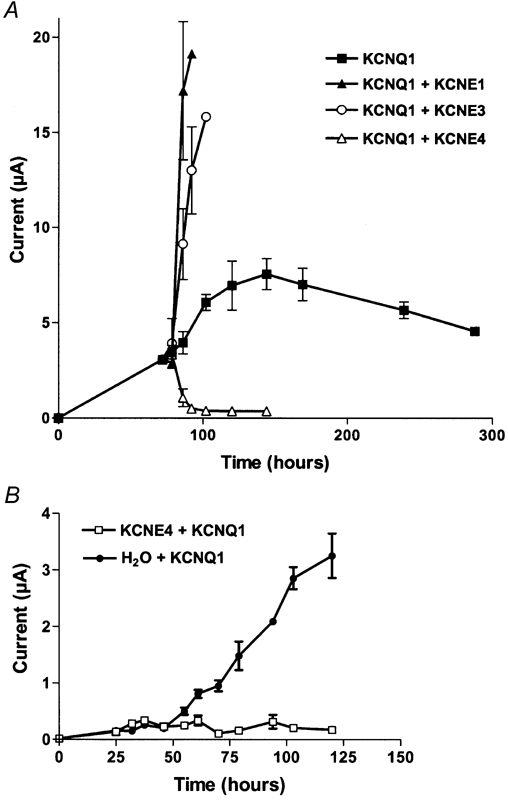
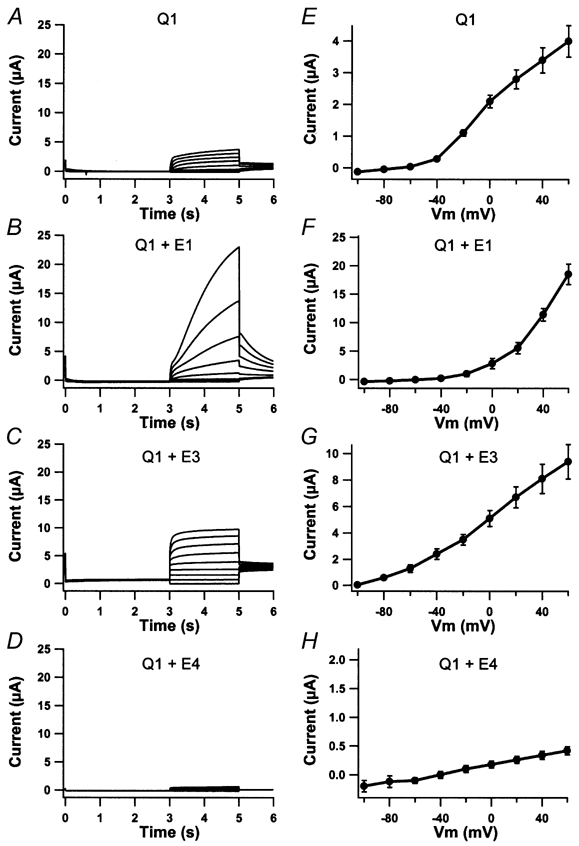
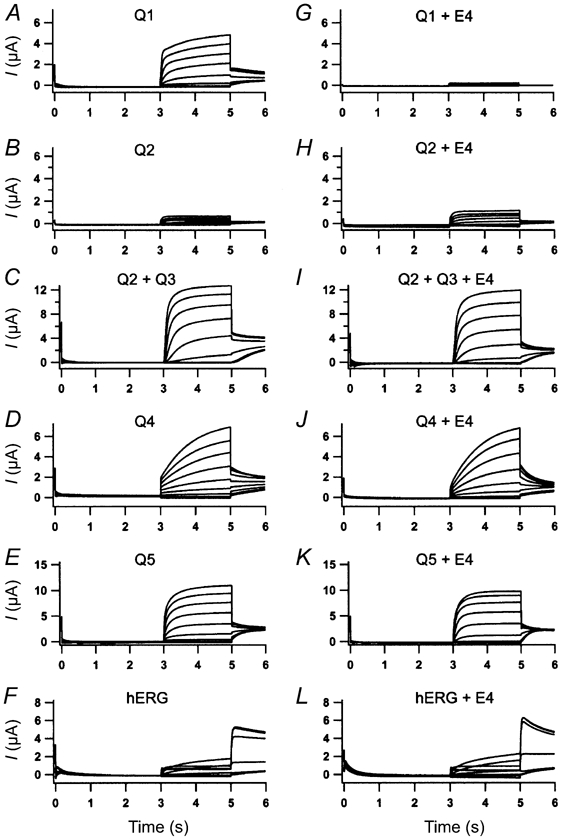
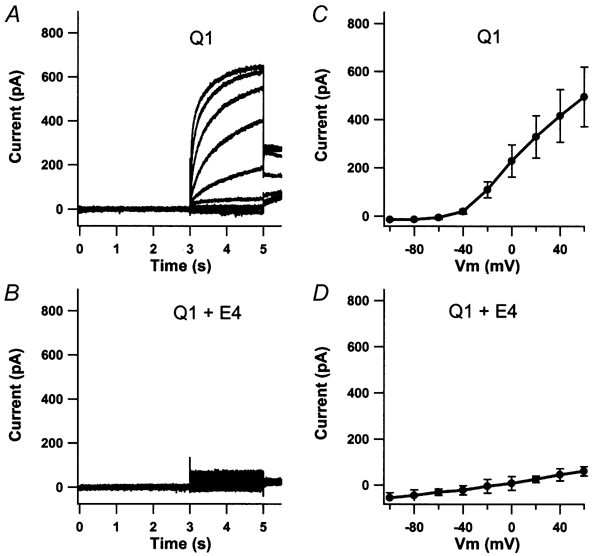
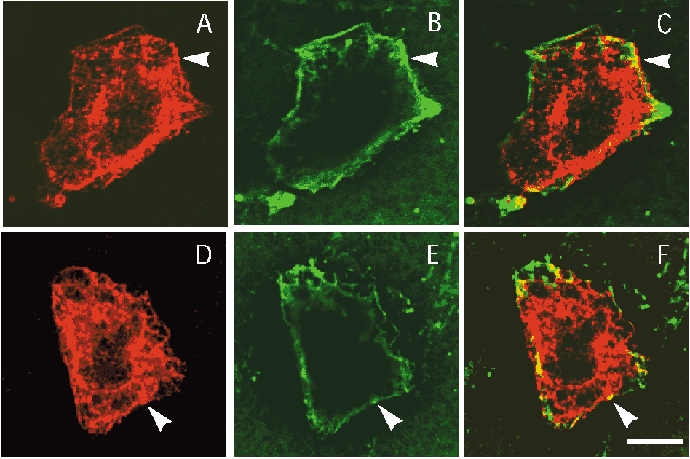
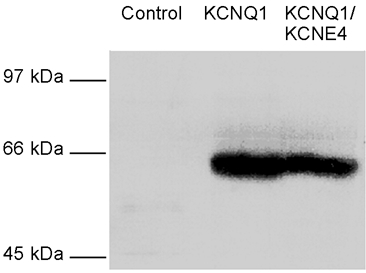
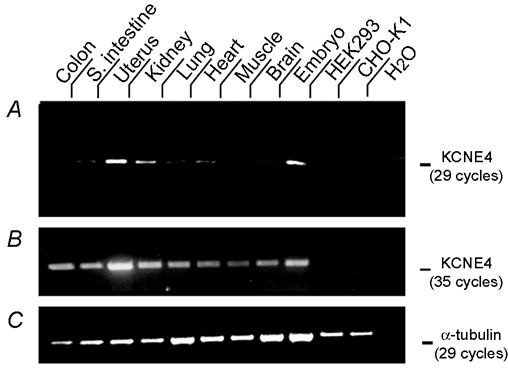
KCNE4 is a membrane protein belonging to a family of single transmembrane domain proteins known to have dramatic effect on the gating of certain potassium channels. However, no functional role of KCNE4 has been suggested so far. In the present paper we demonstrate that KCNE4 is an inhibitory subunit to KCNQ1 channels. Co-expression of KCNQ1 and KCNE4 in Xenopus oocytes completely inhibited the KCNQ1 current. This was reproduced in mammalian CHO-K1 cells. Experiments with delayed expression of mRNA coding for KCNE4 in KCNQ1-expressing oocytes suggested that KCNE4 exerts its effect on KCNQ1 channels already expressed in the plasma membrane. This notion was supported by immunocytochemical studies and Western blotting, showing no significant difference in plasma membrane expression of KCNQ1 channels in the presence or absence of KCNE4. The impact of KCNE4 on KCNQ1 was specific since no effect of KCNE4 could be detected if co-expressed with KCNQ2-5 channels or hERG1 channels. RT-PCR studies revealed high KCNE4 expression in embryos and adult uterus, where significant expression of KCNQ1 channels has also been demonstrated.


Figures

Figure 1
Figure 1. KCNE4 subunits inhibit KCNQ1 current
Oocytes were clamped at -80 mV for 3 s and current traces were elicited by 2 s voltage steps for potentials ranging from -100 to +60 mV in 20 mV increments. Tail currents were recorded at -30 mV. Maximal current levels were measured at the end of the 2 s voltage step. Oocytes expressing only KCNQ1 channels (A) responded to this voltage protocol with a slowly activating current having a maximum level at 3.40 ± 0.8 μA recorded at +60 mV (n = 55). In contrast, oocytes injected with both KCNQ1 and KCNE4 mRNA (B) showed only a very limited response to the applied voltage protocol with a maximum current level of 0.28 ± 0.12 μA recorded at +60 mV (n = 37). The corresponding averaged I-V curves revealed a voltage-gated current activated at approximately -50 mV for KCNQ1-expressing oocytes (C) and a linear I-V curve for KCNQ1 -KCNE4 expressing oocytes (D) without any obvious voltage dependency.
Figure 2
Figure 2. KCNQ1 current can be modified by delayed injection of KCNE subunits
A, oocytes injected with KCNQ1 mRNA alone were incubated for 72 h to secure a stable current level at approximately 3 μA recorded at +60 mV (▪). KCNE1, 3 or 4 were subsequently injected and the current level at +60 mV was measured every 6 h. Both KCNE1 (▴)- and KCNE3 (○)-injected oocytes responded with a large augmentation of the maximal current. In contrast, in KCNE4-injected oocytes (▵) the KCNQ1 current decreased significantly. KCNQ1-expressing oocytes which were not further injected with any KCNE subunits continued to increase expression until a maximal current of approximately 8 μA was reached after 6 days. B, KCNE4-expressing oocytes were injected with KCNQ1 mRNA (□) or H2O (•) after 24 h delay, and KCNQ1 current was subsequently followed. No specific KCNQ1 current could be observed at any time in the presence of KCNE4 indicating that this subunit was not able to increase the turnover of KCNQ1 channels. For every point four individual oocytes were measured and the data averaged.
Figure 3
Figure 3. Corresponding current traces and I-V curves from the four groups of oocytes described in Fig. 2
KCNQ1-expressing oocytes in the absence of KCNE injection (A) or after delayed injection with KCNE1 (B), KCNE3 (C) or KCNE4 (D) were activated by voltage steps at potentials ranging from -100 to +60 mV with 20 mV increments. Tail currents were recorded at -30 mV and oocytes were clamped at -80 mV for 3 s between each voltage ramp. The corresponding averaged I-V curves are shown in E-H. Recordings were performed 84 h after KCNQ1 injection and 12 h after KCNE injection.
Figure 4
Figure 4. KCNE4 interacts specifically with KCNQ1
Oocytes injected with KCNQ1 (A), KCNQ2 (B), KCNQ2+3 (C), KCNQ4 (D), KCNQ5 (E) or hERG1 (F) mRNA were subject to voltage activation. From a holding potential of -80 mV that lasted for 3 s, current traces were elicited by 2 s voltage steps ranging from -100 to +60 mV in 20 mV increments. Tail current was recorded at -30 mV. All oocytes responded as expected and were subsequently injected with KCNE4 mRNA. After 24 h incubation, oocytes were again subjected to the above-mentioned voltage protocol. KCNQ1 -KCNE4-expressing oocytes (G) responded with a markedly reduced current while KCNQ2 -KCNE4 (H)-, KCNQ2+3 -KCNE4 (I)-, KCNQ4 -KCNE4 (J)-, KCNQ5 -KCNE4 (K)- and hERG1 -KCNE4 (L)-expressing oocytes showed no change in their response KCNE4. For all panels n = 4.
Figure 5
Figure 5. KCNE4 inhibition of KCNQ1 current after expression in a mammalian expression system
Traces represent whole-cell currents recorded during application of voltage ramps. CHO-K1 cells were clamped at -80 mV for 3 s and current traces elicited by 2 s voltage ramps for potentials from -100 mV to +60 mV in 20 mV increments. Tail currents were recorded at -30 mV. In CHO-K1 cells only expressing KCNQ1, this voltage protocol resulted in a slowly activating, non-inactivating voltage-dependent current (A). The average current amplitude recorded at +60 mV was 79.3 ± 27 pA pF−1 (n = 5). In contrast, co-expression of KCNQ1 and KCNE4 resulted in a dramatic reduction in the observed maximum current with a maximum average current amplitude of 10.3 ± 4 pA pF−1 (n = 6) (B). The responding I-V curves are shown in C and D, respectively.
Figure 6
Figure 6. Confocal fluorescence analysis of the subcellular localization of exogenous KCNQ1 in CHO-K1 cells
Cells were transfected with KCNQ1 (A-C) or KCNQ1-KCNE4 (D-F) and the cell surface was biotinylated. After biotinylation cells were fixed and permeabilized, then double-labelled with anti-KCNQ1 antibody (red) and Alexa 488-streptavidin (green). In both cases KCNQ1 (A and D) displayed membrane labelling (arrowheads) as demonstrated by the colocalization with Alexa 488-streptavidin staining (B and E). KCNQ1 labelling was also observed in intracellular structures probably due to the high level of expression. C shows images A and B overlaid and F shows D and E overlaid. Scale bar, 8 μm.
Figure 7
Figure 7. KCNE4 can interact with KCNQ1 present in the plasma membrane
Oocytes were biotinylated with sulfo-NHS-SS-biotin and membranes subsequently purified by differential centrifugation. Biotinylated proteins were isolated on streptavidin-coupled agarose beads. Following SDS-PAGE and electroblotting, transferred biotinylated proteins were stained with the KCNQ1 antibody and revealed using ECL. KCNQ1 was expressed at comparable levels in the plasma membrane in the absence and presence of KCNE4.
Figure 8
Figure 8. Tissue distribution of KCNE4
A, RT-PCR analyses of total RNA extracted from NMRI mouse tissue, 14-day-old embryo Swiss Webster mice (Ambion) and HEK 293 and CHO-K1 cells were performed using primers flanking the entire KCNE4 coding region, thereby giving rise to the 487 bp band on an ethidium bromide-stained agarose gel. When 29 PCR cycles were performed, intense labelling was observed in uterus and embryonic tissue. Increasing the number of PCR cycles to 35, gave specific bands for all tissue tested (B). To secure equal amounts of cDNA in each reaction α-tubulin was included as an internal standard. These results are shown in C.

References

    1. Abbott GW, Butler MH, Bendahhou S, Dalakas MC, Ptacek LJ, Goldstein SA. MiRP2 forms potassium channels in skeletal muscle with Kv3. 4 and is associated with periodic paralysis. Cell. 2001;104:217–231. - PubMed
    1. Abbott GW, Sesti F, Splawski I, Buck ME, Lehmann MH, Timothy KW, Keating MT, Goldstein SA. MiRP1 forms IKr potassium channels with HERG and is associated with cardiac arrhythmia. Cell. 1999;97:175–187. - PubMed
    1. Barhanin J, Lesage F, Guillemare E, Fink M, Lazdunski M, Romey G. KVLQT1 and lsK (minK) proteins associate to form the I(Ks) cardiac potassium current. Nature. 1996;384:78–80. - PubMed
    1. Boucherot A, Schreiber R, Kunzelmann K. Regulation and properties of KCNQ1 (KVLQT1) and impact of the cystic fibrosis transmembrane conductance regulator. Journal of Membrane Biology. 2001;182:39–47. - PubMed
    1. Demolombe S, Franco D, de Boer P, Kuperschmidt S, Roden D, Pereon Y, Jarry A, Moorman AF, Escande D. Differential expression of KvLQT1 and its regulator IsK in mouse epithelia. American Journal of Physiology – Cell Physiology. 2001;280:C359–372. - PubMed

Publication types

MeSH terms

LinkOut - more resources