. 2002 Jul 1;542(Pt 1):131-46.
doi: 10.1113/jphysiol.2001.015610.

Dual and opposing roles of presynaptic Ca2+ influx for spontaneous GABA release from rat medial preoptic nerve terminals

Affiliations

Dual and opposing roles of presynaptic Ca2+ influx for spontaneous GABA release from rat medial preoptic nerve terminals

Michael Druzin et al. J Physiol. .

Abstract

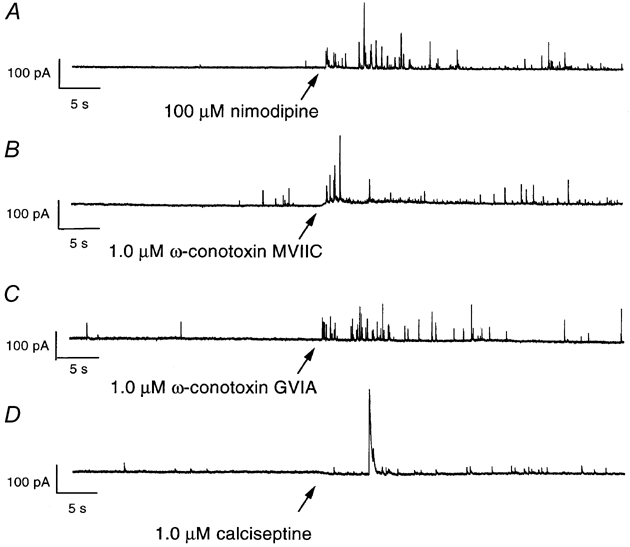
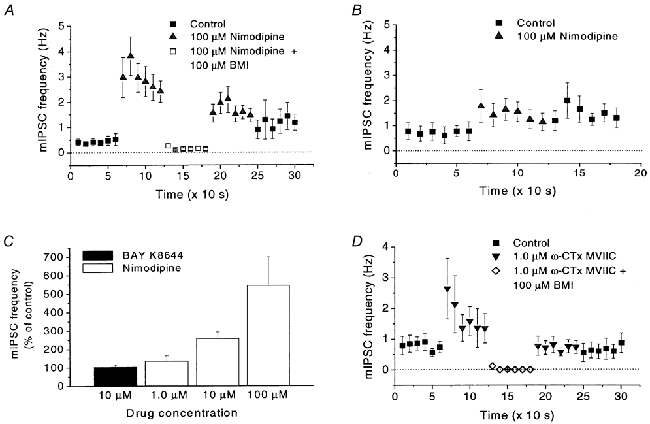
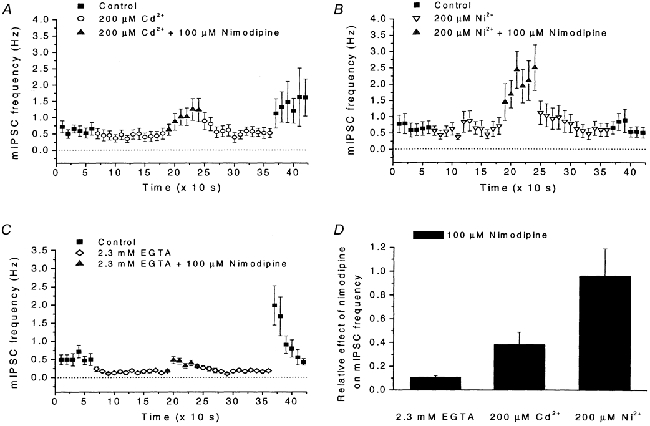
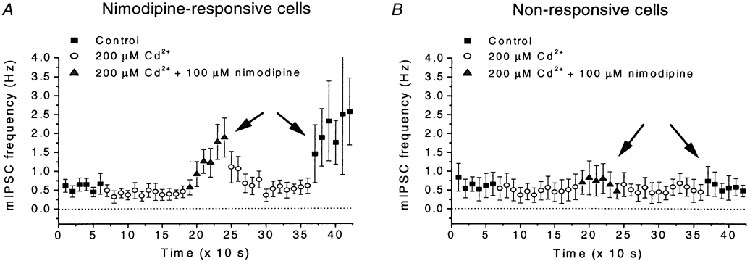
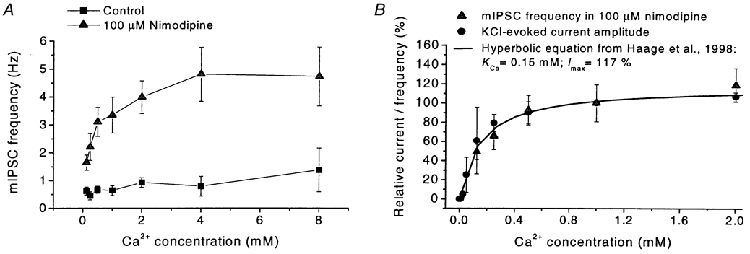
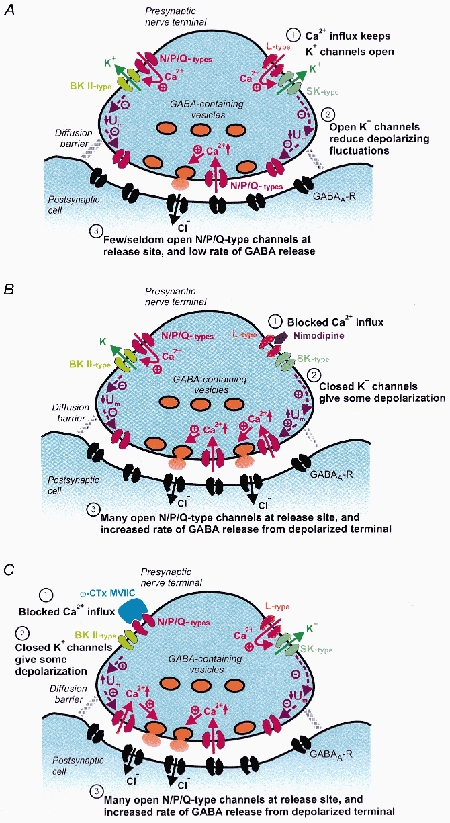
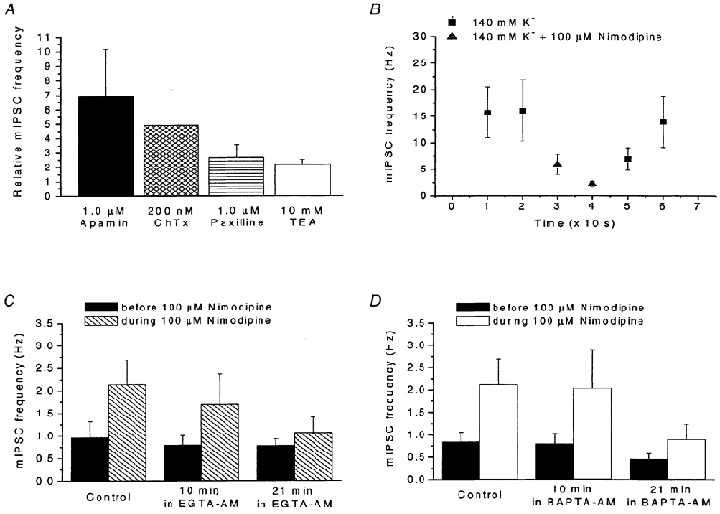
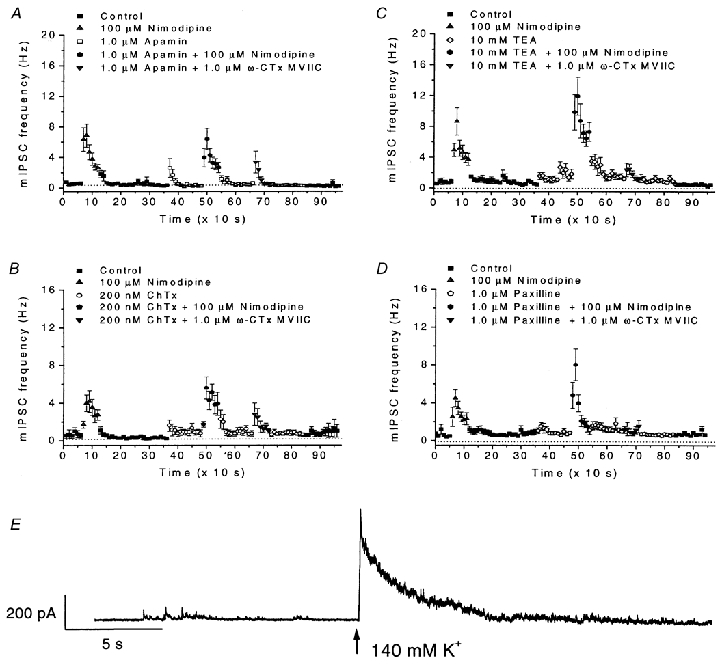
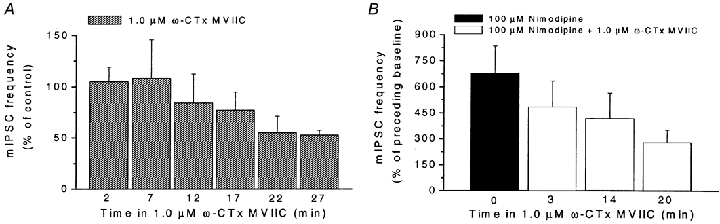
Calcium influx into the presynaptic nerve terminal is well established as a trigger signal for transmitter release by exocytosis. By studying dissociated preoptic neurons with functional adhering nerve terminals, we here show that presynaptic Ca2+ influx plays dual and opposing roles in the control of spontaneous transmitter release. Thus, application of various Ca2+ channel blockers paradoxically increased the frequency of spontaneous (miniature) inhibitory GABA-mediated postsynaptic currents (mIPSCs). Similar effects on mIPSC frequency were recorded upon washout of Cd2+ or EGTA from the external solution. The results are explained by a model with parallel Ca2+ influx through channels coupled to the exocytotic machinery and through channels coupled to Ca2+-activated K+ channels at a distance from the release site.


Figures

Figure 1
Figure 1. Ca2+ channel blockers increase the frequency of mIPSCs in dissociated neurons
Nimodipine (100 μM, A), ω-conotoxin MVIIC (1.0 μM, B), ω-conotoxin GVIA (1.0 μM, C) and calciseptine (1.0 μM, D) were added to the external solution, starting at the time indicated by arrows. Note the resulting increase in mIPSC frequency. Current recorded with the postsynaptic membrane potential clamped at -4 mV. Currents presented in A and B were recorded from the same cell, C and D from two different cells.
Figure 2
Figure 2. Effect of Ca2+ channel blockers on the frequency of mIPSCs
A, change in mIPSC frequency in dissociated neurons caused by nimodipine (100 μM). Note the increase caused by nimodipine and the block caused by addition of bicuculline methiodide (BMI; 100 μM). The number of mIPSCs was measured during 10 s intervals in 17 cells. B, in a slice preparation, nimodipine (100 μM) also affects the mIPSC frequency. Note the similar, although smaller, reaction to nimodipine as in dissociated neurons (A). The number of mIPSCs was measured as in A, in eight cells. C, effects of nimodipine (1.0, 10 and 100 μM) or Bay K 8644 (10 μM) on mIPSC frequency (measured for 1 min) in the same group of cells (n = 9). Note the lack of effect of Bay K 8644. D, effects of ω-conotoxin MVIIC (ω-CTx MVIIC; 1.0 μM) and of BMI (100 μM) on mIPSC frequency in 10 cells, measured as in A. For all recordings the postsynaptic membrane potential was clamped at -4 mV. Error bars indicate s.e.m.
Figure 3
Figure 3. Effects of Cd2+, Ni2+ and EGTA on mIPSC frequency and on response to nimodipine
A, effects of Cd2+ (200 μM), and of nimodipine (100 μM) in the presence of Cd2+, on mIPSC frequency. Note the reduced mIPSC frequency, as well as the increase in mIPSC frequency after washout of Cd2+. Recording conditions and data presentation similar to those in Fig. 2A. Data from 11 cells. B, effects of Ni2+ (200 μM), and of nimodipine (100 μM) in the presence of Ni2+, on mIPSC frequency. Recording conditions and data presentation similar to those in A. Data from 11 cells. C, number of mIPSCs in control solution, in EGTA (2.3 mm) added to the control solution, and with nimodipine (100 μM) added to the EGTA-containing solution. Note the qualitatively similar effects compared with those seen with the application of Cd2+ in A. Recording conditions and data presentation similar to those in A. Data from 15 cells. D, summary of the effects of nimodipine (100 μM) on the mIPSC frequency (measured for 1 min) in the presence of EGTA (2.3 mm), Cd2+ (200 μM) or Ni2+ (200 μM). The effects are indicated relative to the response to nimodipine when added to control solution. Note that nimodipine evoked similar responses in Ni2+-containing solution and in control solution.
Figure 4
Figure 4. Effects of Cd2+ and of nimodipine in the presence of Cd2+ on mIPSC frequency
The cells were grouped on basis of a significant response to nimodipine (100 μM) when added to control solution. A, nimodipine-responsive cells (n = 6). B, non-responsive cells (n = 5). Note that nimodipine-sensitive cells also showed some response in Cd2+ (200 μM), and that the sensitivity to nimodipine was correlated with an increased mIPSC frequency after washout of Cd2+, which was not seen in the non-responsive cells. Correlation marked by arrows in A and B. Recording conditions and data presentation similar to those in Fig. 2A.
Figure 5
Figure 5. Relation between external Ca2+, mIPSC frequency and response to nimodipine
A, relation between external Ca2+ concentration and mIPSC frequency in standard extracellular solution (squares) and mIPSC frequency at the application of nimodipine (100 μM, triangles; measured during first 60 s after nimodipine application). Note the weak dependence of mIPSC frequency on external Ca2+ in control solution. Each point represents data from 15 cells, except for 1.0 mm Ca2+: 54 cells. Holding potential -4 mV. Error bars represent s.e.m.B, relation between external Ca2+ and mIPSC frequency at the application of nimodipine (100 μM, triangles) as in A, with superimposed relation between external Ca2+ and the peak amplitude of the GABAA receptor-mediated synaptic current evoked by the application of 140 mm K+ (filled circles; data from Haage et al. 1998). The smooth line is described by a hyperbolic equation with a half-saturating Ca2+ concentration of 0.15 mm and maximum current/mIPSC frequency 117 % of that at 1.0 mm Ca2+, as described by Haage et al. (1998).
Figure 6
Figure 6. Hypothetical model of nerve terminal on MPN neuron
A, the presynaptic nerve terminal in control conditions. The terminal contains Ca2+ channels, of L- and N-, and P/Q-types, located outside the release site. Ca2+ influx through these channels leads to activation of Ca2+-gated K+ channels that exert major influence on the membrane potential. The membrane potential, in turn, controls Ca2+ channels, of N-, P- or Q-type, at the transmitter release site. Note that outside the release site, N- and P/Q-type Ca2+ channels are coupled to BK channels (left), whereas L-type Ca2+ channels are coupled to SK channels (right). B and C, blocking of the Ca2+ channels outside the release site by nimodipine (B) or ω-conotoxin MVIIC (C) is followed by closure of nearby Ca2+-gated K+ channels and depolarization. The depolarization causes activation of Ca2+ channels at the release site, and the Ca2+ influx triggers transmitter release. Note the presence of a diffusion barrier between the extrasynaptic part of the extracellular space and the synaptic cleft. This barrier is limiting rapid access of large blocking molecules to the Ca2+ channels at the release site. Note that the figure is a simplification and that the membrane potential of the terminal is expected to fluctuate around a mean value in A which differs from that in B and C.
Figure 7
Figure 7. Effects of K+ channel manipulation on mIPSC frequency
A, effects of the K+ channel blockers apamin (1.0 μM; n = 17), charybdotoxin (ChTx, 200 nm; n = 10), paxilline (1.0 μM; n = 15) and TEA (10 mm, n = 13) on mIPSC frequency. Data presented relative to control. The number of mIPSCs was measured during a 60 s period immediately before and just after the application of K+ channel blocker. B, effect of a high external K+ concentration (140 mm) on the response to nimodipine (100 μM). Frequency of mIPSCs in an external solution containing 140 mm K+ without Ca2+ channel blocker (squares) and after addition of 100 μM nimodipine (triangles). Note the reduced mIPSC frequency in the presence of nimodipine. Data from 7 cells. C and D, effects of the slow Ca2+ buffer EGTA-AM (C) and the fast Ca2+ buffer BAPTA-AM (D) on mIPSC frequency and on the response to nimodipine. The number of mIPSCs was measured during a 60 s period of nimodipine application to two groups of neurons (6 cells in each). Data presented relative to preceding baseline measured during a 60 s period immediately before addition of 100 μM nimodipine to the control solution and to Ca2+ buffer-containing solution after 10 and 21 min of preincubation with either 100 μM EGTA-AM or 100 μM BAPTA-AM. Note the block of response to nimodipine after 21 min of preincubation with EGTA-AM (C) and the reduced response caused by 21 min in BAPTA-AM (D). For all data, recording conditions similar to those in Fig. 2A. Error bars represent s.e.m.
Figure 8
Figure 8. Effects of K+ channel blockers on response to nimodipine
A-D, effects of the K+ channel blockers apamin (1.0 μM; A), charybdotoxin (ChTx, 200 nm; B), TEA (10 mm; C) and paxilline (1.0 μM; D) on mIPSC frequency and on the responses to nimodipine (100 μM) and to ω-conotoxin MVIIC (ω-CTx MVIIC; 1.0 μM). Data from 17 (A), 10 (B), 13 (C) and 15 (D) cells. Note the scale in A and B differs from that in C and D. Note also the large effect of nimodipine, but small effect of ω-conotoxin MVIIC, in the presence of the K+-channel blockers in C and D. Data presentation similar to those in Fig. 2A. E. Effect of raising the external K+ concentration (to 140 mm at the time indicated by an arrow) in the presence of a mixture of apamin (1.0 μM), charybdotoxin (ChTx; 200 nm) and TEA (10 mm). The cells were pre-treated with the mixture of K+-channel blockers for 5 min. Note the dramatic increase of mIPSC frequency upon application of K+-rich solution. For all data, recording conditions similar to those in Fig. 2A. Error bars represent s.e.m.
Figure 9
Figure 9. Effects of long-duration application of ω-conotoxin MVIIC on basal mIPSC frequency and on response to nimodipine
A, change in mIPSC frequency caused by long duration application of ω-conotoxin MVIIC (ω-CTx MVIIC; 1.0 μM) in 5 cells. The number of mIPSCs was measured during 60-s periods with 4-min intervals. Note the slow decline (after the initial increase) in mIPSC frequency in the presence of ω-conotoxin MVIIC. Data presented relative to control. B, reduced response to nimodipine (100 μM) caused by long-duration application of ω-conotoxin MVIIC (ω-CTx MVIIC; 1.0 μM) in 5 cells. The number of mIPSCs was measured during a 60-s period of nimodipine application. Data presented relative to preceding baseline. The baseline was measured during a 60-s period immediately before addition of nimodipine (in the presence of ω-CTx MVIIC, for 2nd to 4th bar). Note the considerable decrease of response to nimodipine after prolonged preincubation with ω-conotoxin MVIIC. For all data, recording conditions similar to those in Fig. 2A. Error bars represent s.e.m.

Similar articles

Cited by

References

    1. Andjus PR, Stevic-Marinkovic Z, Cherubini E. Immunoglobulins from motoneurone disease patients enhance glutamate release from rat hippocampal neurones in culture. Journal of Physiology. 1997;504:103–112. - PMC - PubMed
    1. Avdonin V, Shibata EF, Hoshi T. Dihydropyridine action on voltage-dependent potassium channels expressed in Xenopus oocytes. Journal of General Physiology. 1997;109:169–180. - PMC - PubMed
    1. Bao J, Li JJ, Perl ER. Differences in Ca2+ channels governing generation of miniature and evoked excitatory synaptic currents in spinal laminae I and II. Journal of Neuroscience. 1998;18:8740–8750. - PMC - PubMed
    1. Bargas J, Howe A, Eberwine J, Cao Y, Surmeier DJ. Cellular and molecular chracterization of Ca2+ currents in acutely isolated, adult rat neostriatal neurons. Journal of Neuroscience. 1994;14:6667–6686. - PMC - PubMed
    1. Behrens R, Nolting A, Reimann F, Schwarz M, Waldschütz R, Pongs O. hKCNMB3 and hKCNMB4, cloning and characterization of two members of the large-conductance calcium-activated potassium channel β subunit family. FEBS Letters. 2000;474:99–106. - PubMed

Publication types

MeSH terms

LinkOut - more resources