. 2002 Jul 1;542(Pt 1):287-99.
doi: 10.1113/jphysiol.2001.014068.

Differential presynaptic inhibition of actions of group II afferents in di- and polysynaptic pathways to feline motoneurones

Affiliations

Differential presynaptic inhibition of actions of group II afferents in di- and polysynaptic pathways to feline motoneurones

E Jankowska et al. J Physiol. .

Abstract

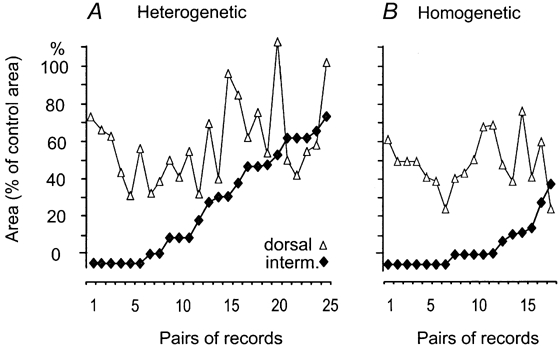
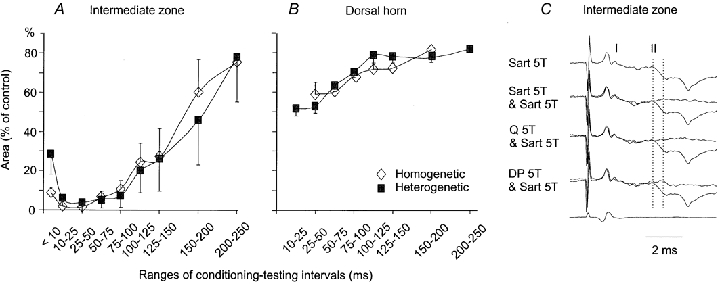
The aim of this study was to investigate differences in the effects of presynaptic inhibition of transmission from group II muscle afferents to neurones in the dorsal horn and in the intermediate zone and the consequences of these differences for reflex actions of group II afferents upon alpha-motoneurones. The degree of presynaptic inhibition was estimated from the degree of depression of monosynaptic components of population EPSPs (field potentials) evoked by group II muscle afferents in deeply anaesthetized cats. The decrease in the area of field potentials was considerably larger and longer lasting in the intermediate zone, where they were often obliterated, than in the dorsal horn, where they were reduced to about two-thirds. Presynaptic inhibition of field potentials evoked by other afferents at the same locations was much weaker. Intracellular records from alpha-motoneurones revealed that short latency EPSPs and IPSPs evoked from group II afferents are considerably reduced by conditioning stimuli that effectively depress intermediate zone field potentials of group II origin. The results of this study lead to the conclusion that strong presynaptic inhibition of transmission to intermediate zone interneurones allows a selective depression of disynaptic actions of group II muscle afferents on alpha- and gamma-motoneurones, mediated by these interneurones, and favours polysynaptic actions of these afferents.


Figures

Figure 1
Figure 1. Examples of the effects of conditioning stimulation of group II afferents on field potentials evoked in the dorsal horn and in the intermediate zone of the L4 segment
The three upper traces in A and B are averaged records of 10 successive field potentials. Those evoked by 2T stimuli (top records) were below threshold for group II actions. Those evoked at 5T represent near-maximal earliest actions of group II afferents (II); in the intermediate zone they were preceded by synaptic actions of group I afferents (I). Four stimuli at 5T applied to the Sart nerve were used as conditioning stimuli; time intervals between the first of these stimuli and the test stimuli were 34 ms (A) and 29 ms (B). Bottom traces in A and B, records of afferent volleys from the cord dorsum. Records in A and B are from the same segment about 2.5 mm apart, at depths of 1.6 and 2.4 mm from the surface. C and D, expanded (4 × vertically, 4 × horizontally) records of rightmost parts of the middle records in A and B. In these superimposed records the thin and thick traces are the test and conditioned responses, respectively. Note the much stronger depression of the group II components of the intermediate zone field potential than of the potential evoked in the dorsal horn. Voltage and time calibrations in D are for the original and expanded records, as indicated. In this and the following figures the negativity is downwards in microelectrode records and upwards in cord dorsum records.
Figure 2
Figure 2. Comparison of changes in the earliest components of field potentials evoked by group I and group II muscle afferents in the intermediate zone and by group II and cutaneous afferents in the dorsal horn
In each panel the broad dark bars and the narrow light bars show the areas and amplitudes of the conditioned potentials, indicated at the bottom of the figure, as a percentage of control potentials, together with bars indicating s.e.m. The combinations of conditioning and test stimuli are indicated above each panel. For example, ‘Q→Sart’ means that the test stimulus was applied to the sartorius nerve while the conditioning stimulus was applied to the quadriceps nerve. The homogenetic effects in E are for stimuli applied to the Q, Sart and DP muscle nerves and to the Saph skin nerve. Trains of 5T stimuli applied 20-30 ms before the test stimuli were used as conditioning stimuli. In each panel are pooled data for the whole sample of the analysed potentials. The number of field potentials is given beneath each bar. Statistically significant differences are indicated by asterisks (* P = 0.01-0.05; ** P < 0.01) and differences that were not statistically significant by ‘ns’.
Figure 3
Figure 3. Comparison of depression of dorsal horn and intermediate zone group II field potentials recorded in the same track
Areas of the earliest components of these potentials (see Methods and Fig. 1C and D) following conditioning stimuli are expressed as percentages of the areas of control potentials. A, effects of heterogenetic conditioning stimulation of group II afferents (i.e. of afferents of another nerve). These include data for all combinations in which the effects of the same stimuli were tested on both intermediate zone and dorsal horn field potentials (from Q on Sart, n = 5; from DP on Sart, n = 1; from Q on DP, n = 15; from Sart on Q, n = 4). B, effects of homogenetic conditioning stimulation (i.e. of stimulation of the same muscle nerve from which the potentials were evoked). These were tested on field potentials evoked from Q (n = 8), Sart (n = 9) and DP (n = 1). The data points for intermediate zone field potentials are ranked according to the degree of the depression, beginning with those that were depressed the most.
Figure 4
Figure 4. Time course of depression of group II field potentials in the intermediate zone and the dorsal horn
Ordinates in A and B represent areas of monosynaptic components of intermediate zone field potentials (n = 4 for homogenetic, n = 5 for heterogenetic) and of dorsal horn field potentials (n = 3 for homogenetic, n = 10 for heterogenetic). Abscissae in A and B represent time intervals between the first conditioning stimuli in a train and test stimuli. Open and filled symbols are for effects evoked by conditioning stimulation of the same (homogenetic) and other nerves (heterogenetic), respectively. C, sample records of plots in A and B. Monosynaptic components of the illustrated intermediate zone group II field potential were measured between the two dotted lines in superimposed records of the test (lower lines) and conditioned (upper lines) potentials. The conditioning-testing interval was 32 ms.
Figure 5
Figure 5. Examples of decreases of EPSPs of group II origin
In A, D and G, top traces are control PSPs evoked in a gracilis motoneurone (A) and in two sartorius motoneurones (D and G) by stimulation of Q at 5T, middle traces are PSPs evoked after a preceding conditioning stimulation of Sart 5T, DP 4T and Sart 4T at conditioning-testing intervals of 77, 83 and 77 ms, respectively, and bottom traces are the corresponding records of incoming volleys from the surface of the spinal cord. B, E and H, superimposed rightmost parts of intracellular records in A, D and G, expanded 3× vertically and 5 × horizontally. Thin traces, control potentials; thick traces, conditioned potentials. Note that the test stimuli evoked disynaptic Ia IPSPs (mediated by inhibitory interneurones represented by the filled circle in the diagram of connections subserving the illustrated actions of group Ia and group II afferents upon spinal motoneurones (Mn) below panel H) followed by EPSPs; the EPSPs were evoked by group II afferents since they required stimuli of at least 3T (mediated by interneurones represented by the open circle in the diagram below panel H). Note also that the conditioning stimuli depressed the EPSPs while the preceding IPSPs were affected only marginally. C, F and I, the differences between traces shown in B, E and H (test – conditioned). Arrows indicate the onset of group II-evoked EPSPs. Calibration pulses shown at the beginning of intracellular records in A, D and G were 1 mV. Voltage calibration bars for the expanded records are shown in C, F and I.
Figure 6
Figure 6. Examples of increases in latency and decreases in amplitude of IPSPs evoked by group II afferents
A, C and E, intracellular records from three unidentified motoneurones (top and middle traces) and the corresponding records of afferent volleys from the surface of the spinal cord (bottom traces). Control records (thin lines) and records of PSPs evoked following conditioning stimulation (thick lines) at 74-76 ms conditioning-testing intervals, as indicated above them are shown. B, D and F, expanded and superimposed records of field potentials in A, C and E. The IPSPs were evoked at segmental latencies of 2.9-3.5 ms. Intermediate zone field potentials evoked from the same nerves in the neighbouring segment had segmental latencies of 2-2.4 ms. G, increases in the latencies of group II IPSPs (ordinate), evoked following conditioning stimuli, plotted against latencies, with respect to group I incoming volleys. Pooled data were used for shorter and longer conditioning-testing intervals. H, decreases in the amplitude of IPSPs of group II origin (ordinate) plotted against changes in amplitude of IPSPs of group I origin in the same motoneurones as in G. Pooled data were used for group II IPSPs which were either preceded or were not preceded by group I IPSPs and for shorter as well as longer conditioning-testing intervals. Calibration pulses shown at the beginning of intracellular records in A, C and E are 1 mV. Voltage calibration bars for the expanded records are shown in B, D and F.
Figure 7
Figure 7. Comparison of effects of presynaptic inhibition on monosynaptic EPSPs and disynaptic IPSPs evoked from group Ia afferents and on IPSPs evoked by group II afferents in a GS motoneurone
A, action potential at the time of recording. B and D, effects of conditioning stimulation of PBST on EPSP evoked from GS at 30 and 80 ms conditioning-testing intervals. C and E, superimposed expanded records of control and conditioned (thicker) EPSPs shown in B and D, and the differences between them. F-I, a similar comparison for IPSPs evoked from DP and conditioned by stimulation of Q. Top records in F show that the late components of these IPSPs were evoked only by stimuli exceeding 2T; their latency (about 3.8 ms from the DP incoming volleys shown in lowermost traces) was only 0.8 ms longer than that of group II intermediate zone field potentials recorded some 10 mm more rostrally. Both this latency and the sharp rising phase of these potentials indicate that they were evoked disynaptically. G, superimposed records of potentials evoked by 2 and 5T stimuli (top records), of the control and conditioned (thicker) records (middle records) and of the differences between them. Arrows indicate the onset of group II-evoked IPSPs. Note that the Ia IPSPs (mediated by interneurones labelled ‘Ia’ in the diagram of connections subserving the illustrated actions of group Ia and group II afferents below panel H) were hardly affected while group II IPSPs (mediated by interneurones labelled ‘II’ in the diagram below panel H) were almost abolished at the shorter interval (F, G) and greatly decreased at the longer interval (H, I). Note also a delay of the remaining group II IPSPs in I.
Figure 8
Figure 8. Diagram of connections suggested by the present study
Open circles indicate populations of interneurones at the indicated locations. Shaded circles indicate GABAergic interneurones mediating presynaptic inhibition of group I, group II and/or cutaneous afferents. Small circles and ellipses indicate excitatory and inhibitory terminals, respectively. Thicker lines in A and C reflect stronger presynaptic inhibition. Further explanations in the text.

Similar articles

Cited by

References

    1. Bras H, Jankowska E, Noga B, Skoog B. Comparison of effects of various types of NA and 5-HT agonists on transmission from group II muscle afferents in the cat. European Journal of Neuroscience. 1990;2:1029–1039. - PubMed
    1. Cavallari P, Edgley SA, Jankowska E. Post-synaptic actions of midlumbar interneurones on motoneurones of hind-limb muscles in the cat. Journal of Physiology. 1987;389:675–689. - PMC - PubMed
    1. Curtis DR, Lacey G. Prolonged GABA(B) receptor-mediated synaptic inhibition in the cat spinal cord: an in vivo study. Experimental Brain Research. 1998;121:319–333. - PubMed
    1. Eccles R, Lundberg A. Synaptic actions in motoneurones by afferents which may evoke the flexion reflex. Archives Italiennes de Biologie. 1959;97:199–221.
    1. Edgley SA, Jankowska E. Field potentials generated by group II muscle afferents in the middle lumbar segments of the cat spinal cord. Journal of Physiology. 1987a;385:393–413. - PMC - PubMed

Publication types

LinkOut - more resources