. 2002 Jul;12(7):1135-41.
doi: 10.1101/gr.221402.

Validation of DNA sequences using mass spectrometry coupled with nucleoside mass tagging

Affiliations

Validation of DNA sequences using mass spectrometry coupled with nucleoside mass tagging

Fadi A Abdi et al. Genome Res. 2002 Jul.

Abstract

We present a mass spectrometry (MS)-based nucleoside-specific mass-tagging method to validate genomic DNA sequences containing ambiguities not resolved by gel electrophoresis. Selected types of (13)C/(15)N-labeled dNTPs are used in PCR amplification of target regions followed by matrix-assisted laser desorption ionization time-of-flight (MALDI-TOF)-MS analysis. From the mass difference between the PCR products generated with unlabeled nucleosides and products containing (13)C/(15)N-labeled nucleosides, we determined the base composition of the genomic regions of interest. Two approaches were used to verify the target regions: The first approach used nucleosides partially enriched with stable isotopes to identify a single uncalled base in a gel electrophoresis-sequenced region. The second approach used mass tags with 100% heavy nucleosides to examine a GC-rich region of a polycytidine string with an unknown number of cytidines. By use of selected (13)C/(15)N-labeled dNTPs (dCTPs) in PCR amplification of the target region in tandem with MALDI-TOF-MS, we determined precisely that this string contains 11 cytidines. Both approaches show the ability of our MS-based mass-tagging strategy to solve critical questions of sequence identities that might be essential in determining the proper reading frames of the targeted regions.


Figures

Figure 1
Figure 1
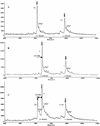
Three fluorescent gel electrophoresis sequencing chromatograms of the same genomic DNA region from chromosome 19 showing the unresolved region of the polycytosine string. Each of these three chromatograms indicated a different number of cytidines.
Figure 2
Figure 2
Negative-ion matrix-assisted laser desorption ionization time-of-flight mass spectrometry (MALDI-TOF-MS) spectra of the unlabeled (UL) and 99% 13C/15N-dCTP-labeled (L) PCR products amplified from genomic DNA with unlabeled dNTPs (A), 99% 13C/15N-labeled dCTP (B), and equal amounts of unlabeled dNTPs and 99% 13C/15N-labeled dCTP (C). “+Na+” indicates sodium adducts. All spectra were obtained using an accelerating voltage of 20 kV, a grid voltage of 95% with 128 average scans, and an extraction delay time of 600 ns.
Figure 3
Figure 3
Negative-ion MALDI-TOF-MS spectrum of a PCR product after exonuclease digestion. This spectrum clearly shows the presence of 11 consecutive cytidines flanked by the known sequence at the 3′ and 5′ ends. The doubly charged ion of the remaining undigested PCR product gave an approximate mass-to-charge (m/z) value of 4581 between the sixth and the seventh sequential cytidines. The secondary series of peaks visible between 2000 and 4500 amu are mainly caused by partial digestion of the complementary strand of the PCR product from the 3′ end.
Figure 4
Figure 4
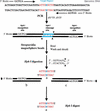
A schematic representation of our strategy for PCR amplification of the target region of the uncalled base in chromosome 16. The synthetic PCR primers are biotinylated and the restriction recognition sites of Hph I are included at the 5′ end of each primer. Hph I has the recognition sequence of 5′…GGTGA (N8)…3′ and 3′…CCACT (N7)…5′, which dictates the restriction cleavage at the 8th base from the 5′ end and the 7th from the 3′ end, resulting in a protruding base at the 3′ end of each strand of the target region. The nucleoside, N, representing the complimentary sequences of the genomic DNA is included in the primer sequences. After PCR amplification and labeling with 13C/15N-labeled nucleoside, x, streptavidin MagneSphere paramagnetic beads are added to the solution to capture the biotinylated PCR products through biotin-streptavidin interactions. The PCR products linked to the beads are washed and then subjected to the Hph I restriction digestion, and the target sequence-containing SNP site(s), “Hph I mid-digest,” or a, is released in solution. The biotin-labeled end of the digest portions (Hph I recognition sequence plus [N]8/[N]7 flanking regions), b and c, are attached to the paramagnetic beads and trapped with a MagneSphere Technology Magnetic Separation Stand. The labeled “Hph I mid-digest,” a, is then desalted via a nitrocellulose membrane and dried for MALDI-TOF analysis. In MALDI-TOF spectra, the 50% 13C/15N-labeled nucleoside, x, will induce a mass shift in the product, a, depending on the number of labeled nucleosides in the target fragment. From the molecular mass of the unlabeled product and the number of peaks present in the labeled product, the number of labeled nucleosides incorporated in the amplified product is determined.
Figure 5
Figure 5
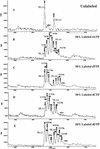
(A) Negative-ion MALDI-TOF-MS spectrum of unlabeled 10-bp PCR product after Hph I restriction digestion. The (−)-strand has an m/z ratio of 3068.2, and the (+)-strand has an m/z ratio of 3120.7. (B) Negative-ion MALDI-TOF-MS spectrum of 50% 13C/15N-dATP-labeled 10-bp product. Four different peaks represent the (−)-strand with m/z ratios of 3069.2, 3082.3, 3098.2, and 3112.1, reflecting the presence of three labeled adenines. Three different peaks with m/z ratios of 3120.6, 3135.8, and 3151.0 are detected for the (+)-strand. The peaks are separated by ∼15 Da each. (C) Negative-ion MALDI-TOF-MS spectrum of 50% 13C/15N-dTTP-labeled 10-bp product. The (−)-strand has three peaks with m/z ratios of 3068.4, 3079.9, and 3091.7. The (+)-strand was represented with four peaks with m/z ratios of 3118.5, 3132.8, 3144.5, and 3156.9. (D) Negative-ion MALDI-TOF-MS spectrum of 50% 13C/15N-dCTP-labeled 10-bp product. The (−)-strand had four peaks with m/z ratios of 3070.3, 3081.8, 3093.3, and 3105.7, whereas the (+)-strand had only two peaks with an m/z ratio of 3121.4 and 3133.6. (E) Negative-ion MALDI-TOF-MS spectrum of 50% 13C/15N-dGTP-labeled 10-bp product. The (−)-strand displayed two peaks with m/z values of 3067.0 and 3081.8. The (+)-strand had four peaks with a mass of 3120.4, 3135.1, 3150.6, and 3164.0. “+Na+” indicates sodium adducts.

Similar articles

References

    1. Abdi F, Bradbury EM, Dogget N, Chen X. Rapid characterization of DNA oligomers and genotyping of single nucleoside polymorphism using nucleotide-specific mass tags. Nucleic Acids Res. 2001;29:61e. - PMC - PubMed
    1. Blackstock WP, Weir MP. Proteomics: Quantitative and physical mapping of cellular proteins. Trends Biotechnol. 1999;17:121–127. - PubMed
    1. Chen X, Fei Z, Smith LM, Bradbury EM, Majidi V. Stable-isotope-assisted MALDI-TOF mass spectrometry for accurate determination of nucleotide compositions of PCR products. Anal Chem. 1999;71:3118–3128. - PubMed
    1. Fei Z, Ono T, Smith LM. MALDI-TOF mass spectrometric typing of single nucleotide polymorphism with mass-tagged dNTPs. Nucleic Acids Res. 1998;26:2827–2828. - PMC - PubMed
    1. Fei Z, Smith LM. Analysis of single nucleotide polymorphisms by primer extension and matrix-assisted laser desorption/ionization time-of-flight mass spectrometry. Rapid Commun Mass Spectrom. 2000;14:950–959. - PubMed

Publication types

MeSH terms

LinkOut - more resources