. 2002 Jul 1;22(13):5462-72.
doi: 10.1523/JNEUROSCI.22-13-05462.2002.

Control of feedforward dendritic inhibition by NMDA receptor-dependent spike timing in hippocampal interneurons

Affiliations

Control of feedforward dendritic inhibition by NMDA receptor-dependent spike timing in hippocampal interneurons

Gianmaria Maccaferri et al. J Neurosci. .

Abstract

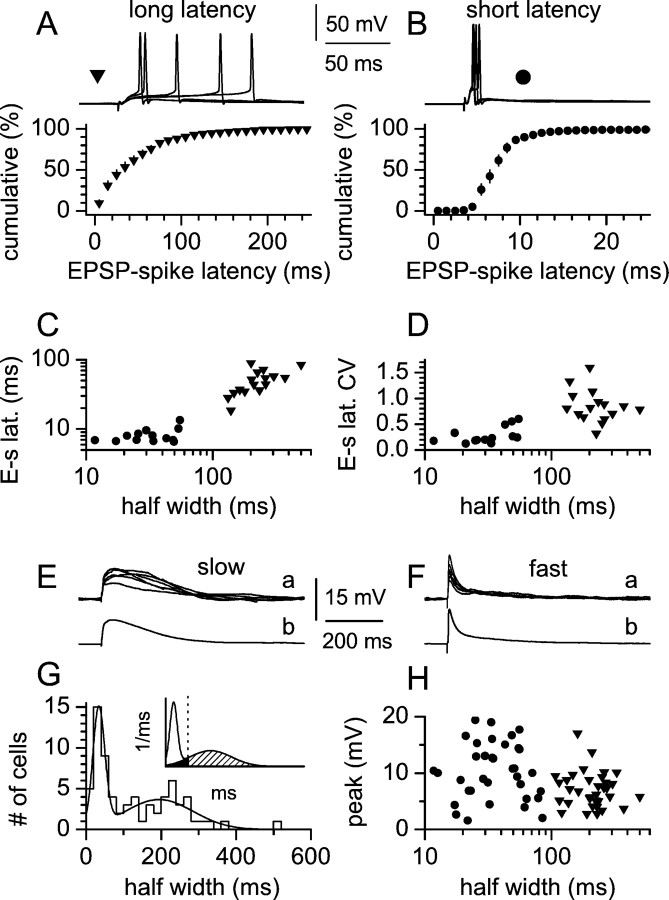
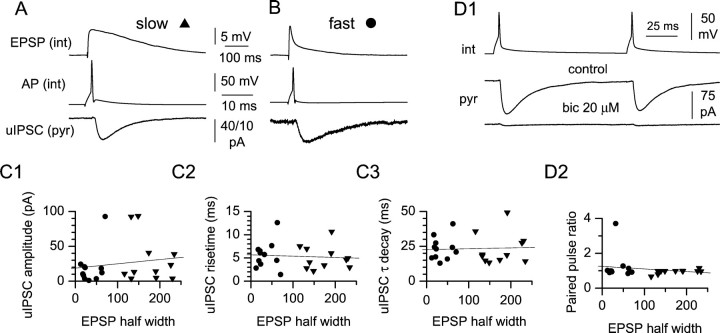
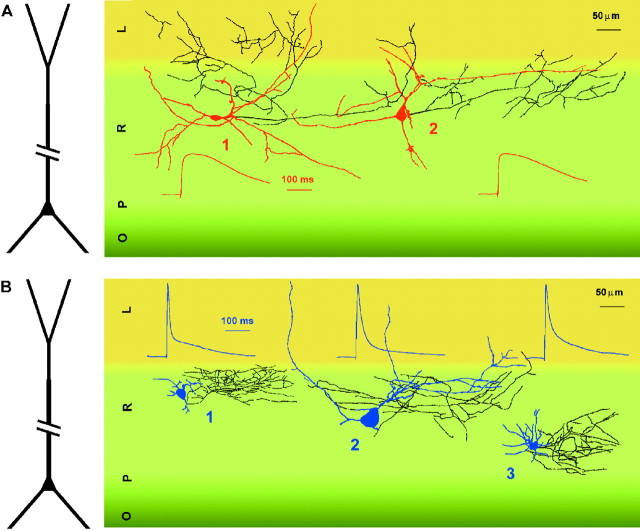
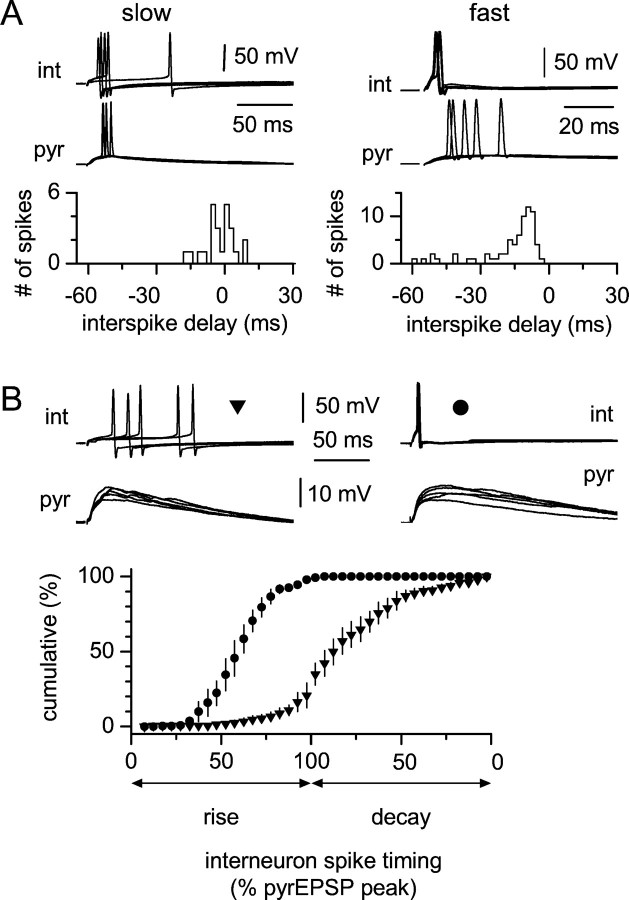
Two putative functional populations of feedforward interneurons with distinct spike-timing properties were identified in stratum radiatum of the CA1 rat hippocampus. Interneurons with fast (half width, <100 msec) EPSPs fired after short EPSP-spike latencies and with a high degree of temporal precision compared with cells with slow (half width, >100 msec) EPSPs. Spike timing in fast and slow interneurons occurred at different phases of the EPSPs of simultaneously activated pyramidal cells. In addition, firing of fast interneurons preceded action potentials in principal neurons, whereas action potentials in slow interneurons could either precede or follow firing in pyramidal cells. Temporal integration of separate inputs leading to synaptically evoked firing was more prominent in slow than fast interneurons. Functional diversity between the two putative populations was abolished by the NMDA receptor (NMDAR) antagonist d-(-)-2-amino-5-phosphonopentanoic acid (d-AP-5). The axon of both cell types was primarily restricted to striatum radiatum or to striatum lacunosum-moleculare in the case of slow cells, suggesting targeting of principal cell dendrites for the majority of the cells of this study. Indeed, firing of slow and fast interneurons generated similar unitary IPSCs (uIPSCs) in pyramidal neurons. uIPSCs were mediated by GABA(A) receptors and had in most cases small amplitudes and slow kinetics. Our results suggest that functionally heterogeneous interneurons encode the temporal properties of dendritic feedforward inhibition, and that NMDARs play an essential role in shaping the integrative properties of interneurons and in setting the timing of GABA release.


Figures

Fig. 1.
Fig. 1.
EPSP-spike coupling in interneurons. A, B, Cumulative distribution of EPSP-spike latencies for long-latency (A, filled triangles) and short-latency (B, filled circles) interneurons at a Pf of ∼0.5. Theinsetsabove the plots show five sweeps for either cell type. Data are the mean ± SE of the individual distributions for 16 slow (A) and 14 fast (B) interneurons. C, Plot of EPSP-spike latencies (E-s lat.) versus EPSP half width. Notice the longer values associated with slower cells compared with faster interneurons. D, Summary graph showing the CV of spike latencies (E-s lat. CV) as a function of EPSP half width. Notice that slower interneurons are associated with more dispersed distributions compared with faster cells. E, F, Subthreshold responses from the same cells as inA and B. G, Distribution of EPSP half width in 70 stratum radiatum interneurons and fit by a sum of two Gaussian functions [y =A1 × exp{−0.5 × [(xx1c)/w1]2} + A2 × exp{−0.5 × [(xx2c)/w2]2}. The values of the parameters obtained by the fit were: A1 = 14.37, x1c = 33.7, w1 = 15.92, A2 = 3.691, x2c = 194.6, w2 = 90.6,R2 = 0.91. Theinset shows the areas delimited by the derived probability density function, the 100 msec threshold (dotted line), and the slow Gaussian component of the probability density function. The area belonging to the fast Gaussian in the interval of >100 msec was negligible. The probability values for the different areas were: white area, 0.405; black area, 0.078; striped area, 0.517. Thex-axis is shown in the 0–600 msec interval.H, EPSP kinetics as a function of EPSP amplitude: notice the similar size of fast (filled circles) and slow (filled triangles) EPSPs and the lack of correlation.
Fig. 2.
Fig. 2.
NMDAR contribution to EPSPs in slow and fast interneurons. A, Effect of d-AP-5 (100 μm) on EPSP half width in slow and fast interneurons.Insets show averaged traces in control and after d-AP-5 application (a, c) and thed-AP-5-sensitive component for slow (b) and fast (d) interneurons. The summary graph on the right shows the individual results (lines) and the overall change in half width in slow (triangles) and fast (circles) interneurons. B, d-AP-5 effect depends on the original half width. Notice that slow EPSPs are more affected by d-AP-5 compared with fast EPSPs.C, Voltage dependency of slow EPSPs at resting (−63 mV) and hyperpolarized (−90 mV) potentials excludes polysynaptic transmission. Inset shows averaged tracesin the two conditions, after scaling to the peak.D, d-AP-5 application converts EPSP-spike coupling properties of slow interneurons. Notice the decrease in both EPSP-spike latency and in the CV of the latency distribution (left plot). On the right, the complete EPSP-spike latency distributions at a Pf of ∼0.5 are shown in controls (filled triangles) and after d-AP-5 application (open triangles). Insets show five sweeps in control conditions (left) and after the addition of the drug (right). E, Classification of slow (filled triangles) and fast (filled circles) interneurons is not a consequence of the stimulated pathway. A summary plot of EPSP half width is shown after stimulation of stratum lacunosum-moleculare (L), the border between stratum lacunosum-moleculare and stratum radiatum (L/R), and stratum radiatum (R). Averaged traces are shown for the different conditions.Dotted lines indicate the 100 msec threshold.
Fig. 3.
Fig. 3.
Firing is NMDAR-dependent in slow interneurons but not in fast cells. Simultaneous plots of membrane potential (bottom), initial EPSP slope (middle), and spike raster (top) in four different cells.A, Slow interneurons at low-intensity stimulation as indicated by the EPSP slope value: notice that firing is completely abolished by d-AP-5. B, At higher stimulation intensities, multiple spikes are generated; both early and late spikes are produced, but only late spikes show d-AP-5 sensitivity. C, D, Fast interneurons produce only single spikes, which are insensitive to d-AP-5 despite the large EPSP slope values. d-AP-5 (100 μm) application is indicated by the black bar.Insets show single sweeps in the control condition (a), in the presence of d-AP-5 (b), and average tracessuperimposed (c). The asteriskindicates the traces in the presence of the drug.
Fig. 4.
Fig. 4.
Integration of synaptic input is different in slow versus fast interneurons. A, Summary plot showing the integrative properties of slow interneurons. Integration is NMDAR-dependent (filled triangles, control;open triangles, d-AP-5). The top panel displays single sweeps for each interstimulus delay.B, Properties of fast interneurons in control (filled circles) and d-AP-5 (open circles). Notice the abrupt decrease in firing probability with the desynchronization of the input and the lack of effect of the drug. The top panel shows singletraces for each interval tested. Notice also the prolongation and amplification of the second EPSP in traces 4 and 5 of A, suggesting the involvement of intrinsic conductances. Dotted lines indicate the Pf = 0.5 level, for reference.
Fig. 5.
Fig. 5.
uIPSCs originating from slow and fast interneurons have similar basic properties. A, Averaged uIPSCs recorded from a pyramidal cell (bottom trace) in response to a spike in the presynaptic interneuron (middle trace). Note the slow kinetics of the evoked EPSP recorded from the interneuron after the addition of bicuculline (20 μm) (top trace). B, Same protocol as inA applied to a fast interneuron. C, Summary plots relating EPSP kinetics to basic uIPSC properties. (triangles, slow interneurons; circles, fast interneurons). No significant correlations could be found in the case of uIPSC amplitude (C1), rise time (C2), and decay time constant (C3).D, Paired-pulse protocol in control and after the addition of bicuculline (bic) (D1).pyr, Pyramidal cell; int, interneuron. Note the virtual abolishment of the response. D2, Summary graph relating paired-pulse ratio to EPSP kinetics.
Fig. 6.
Fig. 6.
Anatomical reconstruction of slow (red) and fast (blue) interneurons and averaged scaled EPSPs recorded in the same cells. Axons are shown inblack. A, Slow interneurons could target stratum lacunosum-moleculare (L, cell 1) or stratum radiatum (R, cell 2).B, Fast interneurons more commonly limited their innervation to stratum radiatum (cells 1–3). Different hippocampal layers are shown in different shades ofgreen/yellow. O, Stratum oriens;P, stratum pyramidale. A representation of the structure of a pyramidal cell is shown at the left for reference.
Fig. 7.
Fig. 7.
Relative spike timing of interneurons and pyramidal cells during CA3→CA1 transmission. A,Left, Interspike interval distribution between a slow interneuron and a pyramidal cell; notice that some spikes in the interneuron precede (negative values of the distribution), while others follow (positive values) firing in the pyramidal cell. Theinset shows five sweeps recorded simultaneously from both cells. Right, Similar experiment performed on a fast cell. Notice that firing in the interneuron always precedes firing in the pyramidal cell, and that only negative values are present in the distribution. B, Spike timing in slow (left) and fast (right) interneurons relative to EPSP rise and decay in simultaneously recorded pyramidal cells; five simultaneous sweeps are shown for each double recording. The summary graph shows cumulative distributions of slow (triangles) and fast (circles) interneurons that are superimposed. The x-axis indicates the spike timing of the interneuron expressed as the normalized pyramidal cell EPSP amplitude, measured at the time of the interneuron spike. Note that slow interneurons are mostly active during the decay phase, whereas fast cells fire exclusively during the rising phase.pyr, Pyramidal cell; int, interneuron.

Similar articles

Cited by

References

    1. Alger BE, Nicoll RA. Feed-forward dendritic inhibition in rat hippocampal pyramidal cells studied in vitro. J Physiol (Lond) 1982;328:105–123. - PMC - PubMed
    1. Bliss TV, Collingridge GL. A synaptic model of memory: long-term potentiation in the hippocampus. Nature. 1993;361:31–39. - PubMed
    1. Borst JGG, Helmchen F, Sakmann B. Pre- and post-synaptic whole-cell recordings in the medial nucleus of the trapezoid body of the rat. J Physiol (Lond) 1995;489:825–840. - PMC - PubMed
    1. Brew HH, Forsythe ID. Two voltage-dependent K+ conductances with complementary functions in postsynaptic integration at a central auditory synapse. J Neurosci. 1995;15:8011–8022. - PMC - PubMed
    1. Buzsaki G. Feed-forward inhibition in the hippocampal formation. Prog Neurobiol. 1984;22:131–153. - PubMed

Publication types

MeSH terms

Substances

LinkOut - more resources