. 2002 Jul 1;22(13):5749-59.
doi: 10.1523/JNEUROSCI.22-13-05749.2002.

Anatomical evidence of multimodal integration in primate striate cortex

Affiliations

Anatomical evidence of multimodal integration in primate striate cortex

Arnaud Falchier et al. J Neurosci. .

Abstract

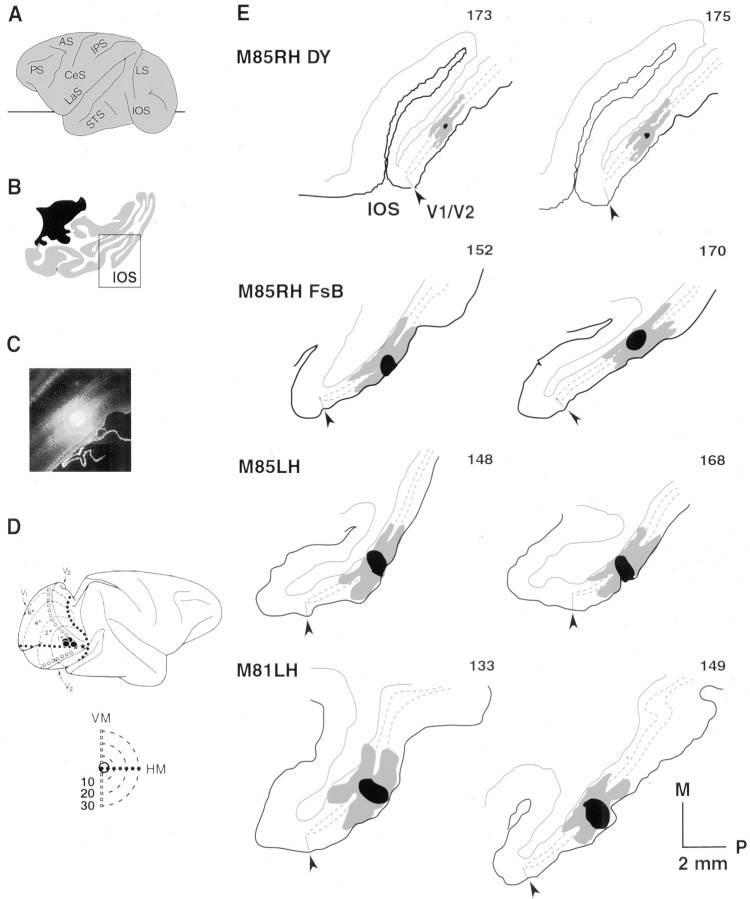
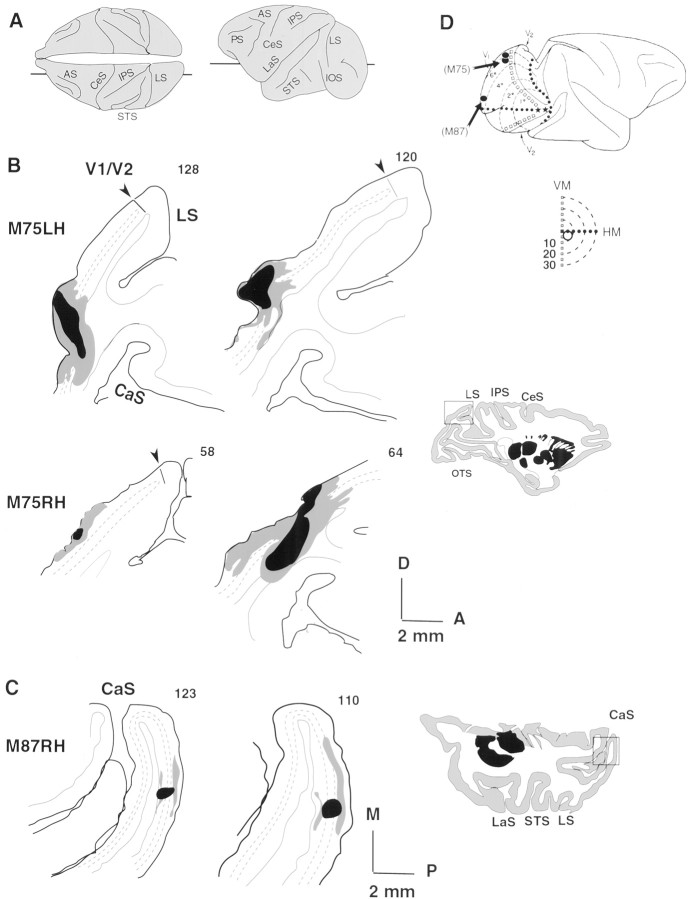
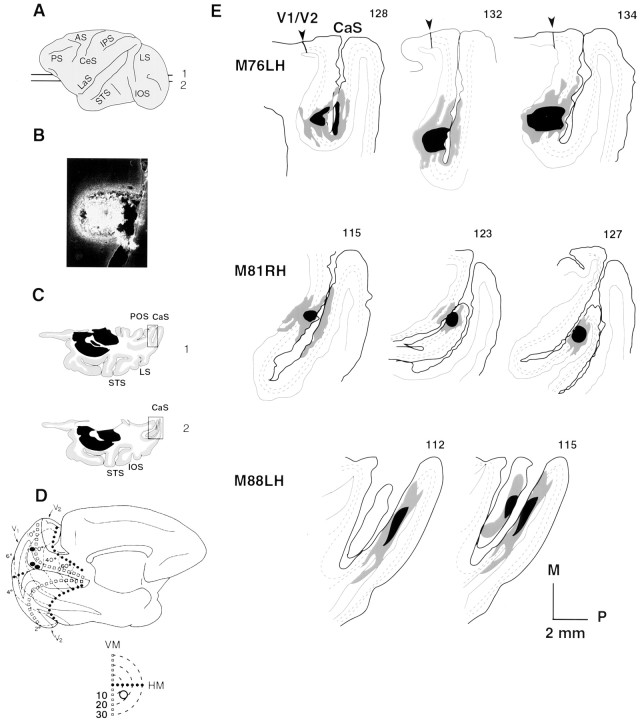
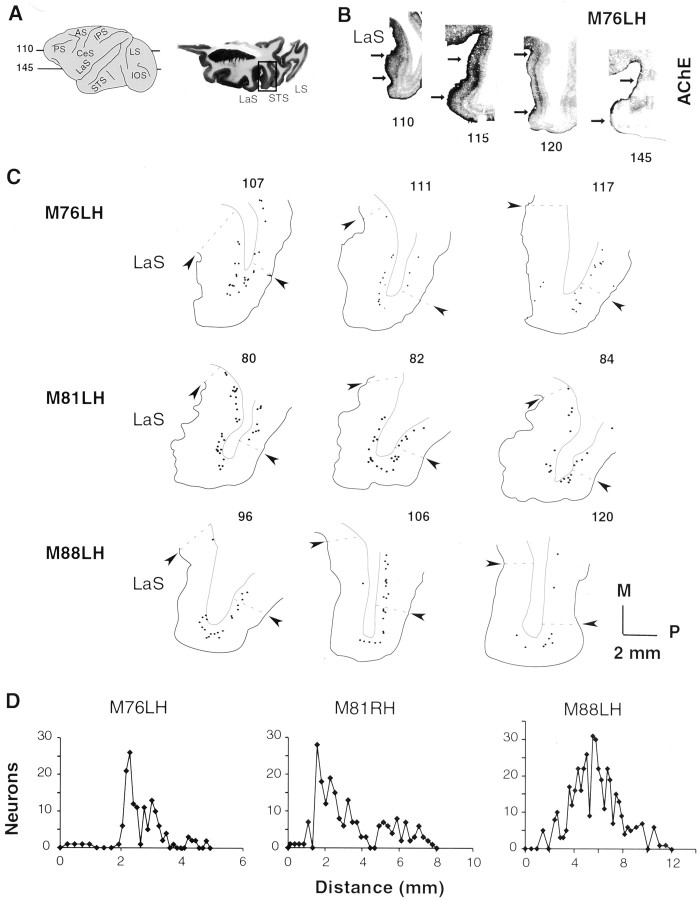
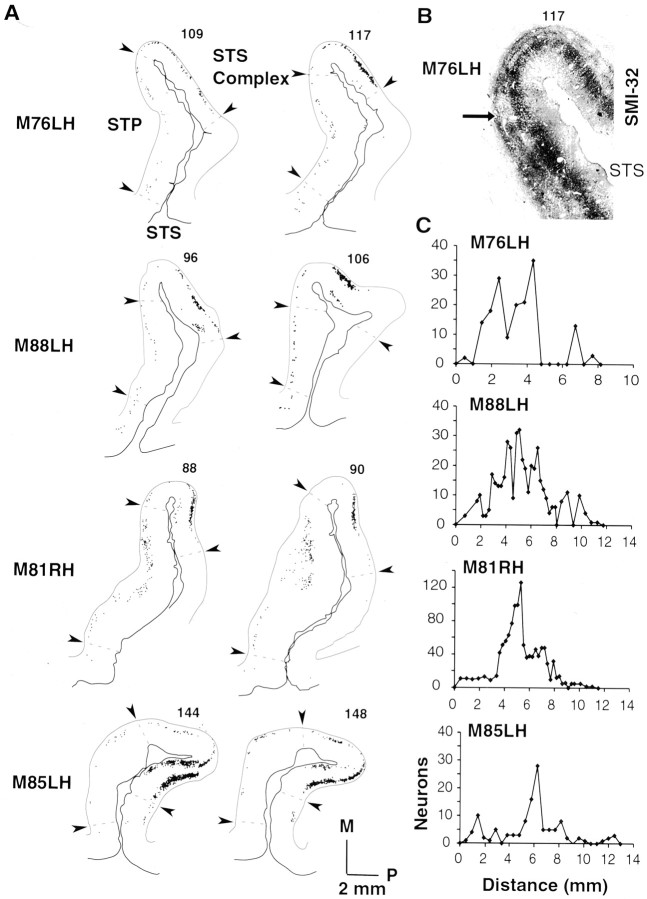
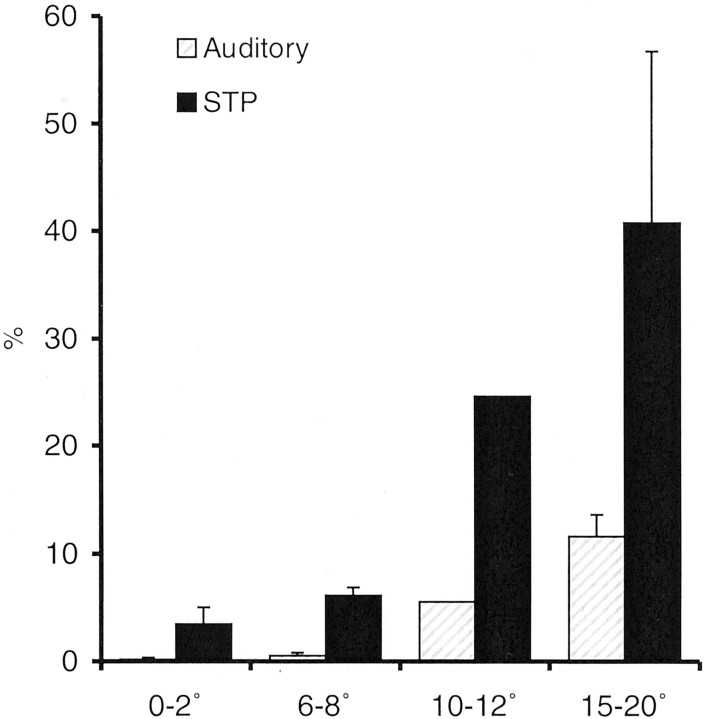
The primary visual cortex (area 17 or V1) is not thought to receive input from nonvisual extrastriate cortical areas. However, this has yet to be shown to be the case using sensitive tracers in the part of area 17 subserving the peripheral visual field. Here we show using retrograde tracers that peripheral area 17 subserving the visual field at an eccentricity of 10-20 degrees receives projections from the core and parabelt areas of the auditory cortex as well as from the polysensory area of the temporal lobe (STP). The relative strength of these projections was calculated for each injection by computing the proportions of retrogradely labeled neurons located in the auditory and STP areas with respect to number of labeled neurons constituting the established projection from the superior temporal sulci (STS) motion complex (middle temporal area, medial superior temporal, fundus of the superior temporal area). In peripheral area V1 the projection from auditory cortex corresponds to 9.5% of that of the STS motion complex and STP to 35% of that from the STS motion complex. Compared to peripheral area 17, central and paracentral area 17 showed considerably weaker inputs from auditory cortex (0.2-0.8%) but slightly more from STP cortex (3.5-6.1%). The present results show that the connectivity of area 17 is eccentricity dependent. Direct projections from auditory and STP cortex to peripheral area 17 have important consequences for higher visual functions of area 17, including multimodal integration at early stages of the visual cortical pathway.


Figures

Fig. 1.
Fig. 1.
Injection sites in area 17 subserving the central visual field. A, Lateral view of the monkey brain showing the level of the injection sites in horizontal sections.B, Representative horizontal section showing location of central injection sites. C, Photomicrograph of DY injection site. D, Lateral view of the brain showing the visual representation of area V1 and location of central injection sites (Gattass et al., 1981). D, Bottom, Injection sites with respect to the visual field. E, Central injection sites, two sections per injection. Uptake zone is shown inblack. Gray, Dense intrinsic labeling of area V1. Numbers refer to section number. Thin lines, White matter–gray matter boundary. Dotted lines, layer 4. Arrowheads, Area V1/V2 border. Cases M85RH FsB, DY, Only one injection site of a pair is shown. IOS, Inferior occipital sulcus;LS, lunate sulcus; CaS, calcarine sulcus;IPS, intraparietal sulcus; CeS, central sulcus; OTS, occipitotemporal sulcus;STS, superior temporal sulcus; LaS,lateral sulcus; AS, arcuate sulcus; PS,principal sulcus; POS, posterior occipital sulcus.
Fig. 2.
Fig. 2.
Injection sites in area 17 subserving the paracentral visual field. A, Dorsal and lateral view of the monkey brain showing the level of the injection sites in parasagittal and horizontal sections. B, Injection sites on dorsal part of the operculum. Inset shows representative parasagittal section showing location of injection sites in M75LH and M75RH. C, Injection site on the posterior part of the operculum. Inset shows representative horizontal section showing location of injection site in M87RH.D, Lateral view of the brain showing visual representation of area V1 and location of paracentral injection sites (taken from Gattass et al., 1981). Bottom, Injection site with respect to the visual field. Conventions and abbreviations as in Figure 1.
Fig. 3.
Fig. 3.
Injection sites in area 17 subserving the peripheral visual field. A, Lateral view of the monkey brain showing the level of the injection sites in horizontal sections.B, Photomicrograph of fast blue injection site.C, Two horizontal sections illustrating the two levels in A. D, Lateral view of the brain showing visual representation of area V1 and location of peripheral injection sites (taken from Gattass et al., 1981). Below, injection sites with respect to the visual field. E, Injection sites in the calcarine sulcus. Conventions and abbreviations as in Figure 1.
Fig. 4.
Fig. 4.
Labeling in auditory cortex after peripheral injections. A, Lateral view of the brain and horizontal section showing levels of sections in B andC. B, AChE labeling;arrows indicate limits of core and belt of the auditory cortex in the lateral sulcus. C, Individual sections showing labeling in auditory cortex. D, Density profiles. Numbers of neurons per section counted between thearrowheads indicated in C. Conventions and abbreviations as in Figure 1.
Fig. 5.
Fig. 5.
Labeling in STP after peripheral injections.A, Individual sections showing labeling in multisensory cortex. Arrowheads show limits within which neurons were counted in STP and in the STS complex. B, SMI-32 labeling; the arrow indicates the limit between area STP and the STS complex. C, Density profiles. Numbers of neurons per section in STP counted between thearrowheads indicated in A. Conventions and abbreviations as in Figure 1.
Fig. 6.
Fig. 6.
Quantitative analysis of labeling in auditory cortex and area STP. Histogram of the mean (±SE) proportion of labeled neurons in auditory cortex and area STP. Percentages refer to the number of neurons observed in the posterior bank of STS (STS complex) (Table 1).

References

    1. Angelucci A, Clasca F, Sur M. Brainstem inputs to the ferret medial geniculate nucleus and the effect of early deafferentation on novel retinal projections to the auditory thalamus. J Comp Neurol. 1998;400:417–439. - PubMed
    1. Baizer JS, Ungerleider LG, Desimone R. Organization of visual inputs to the inferior temporal and posterior parietal cortex in macaques. J Neurosci. 1991;11:168–190. - PMC - PubMed
    1. Barone P, Clarey JC, Irons WA, Imig TJ. Cortical synthesis of azimuth-sensitive single-unit responses with nonmonotonic level tuning: a thalamocortical comparison in the cat. J Neurophysiol. 1996;75:1206–1220. - PubMed
    1. Barone P, Batardière A, Knoblauch K, Kennedy H. Laminar distribution of neurons in extrastriate areas projecting to V1 and V4 correlates with the hierarchical rank and indicates the operation of a distance rule. J Neurosci. 2000;20:3263–3281. - PMC - PubMed
    1. Batardière A, Barone P, Dehay C, Kennedy H. Area-specific laminar distribution of cortical feedback neurons projecting to cat area 17: quantitative analysis in the adult and during ontogeny. J Comp Neurol. 1998;396:493–510. - PubMed

Publication types

Substances

LinkOut - more resources