Comparative Study
. 2002 Jul 23;99(15):9846-51.
doi: 10.1073/pnas.142089199. Epub 2002 Jul 3.

Visualization of maltose uptake in living yeast cells by fluorescent nanosensors

Affiliations
Comparative Study

Visualization of maltose uptake in living yeast cells by fluorescent nanosensors

Marcus Fehr et al. Proc Natl Acad Sci U S A. .

Abstract

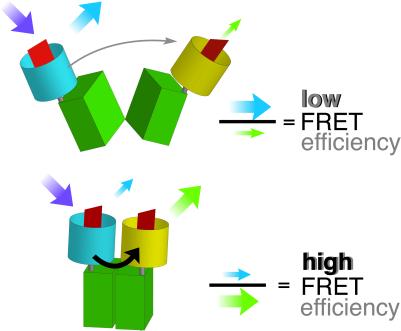
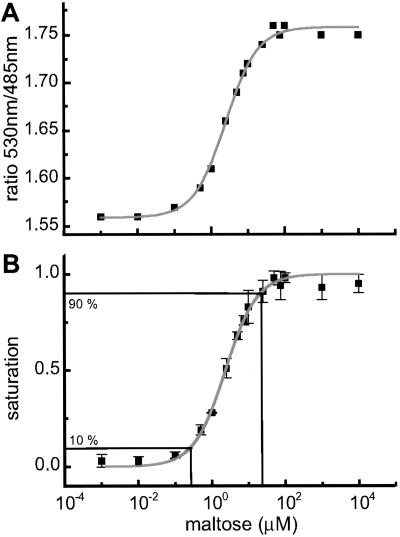
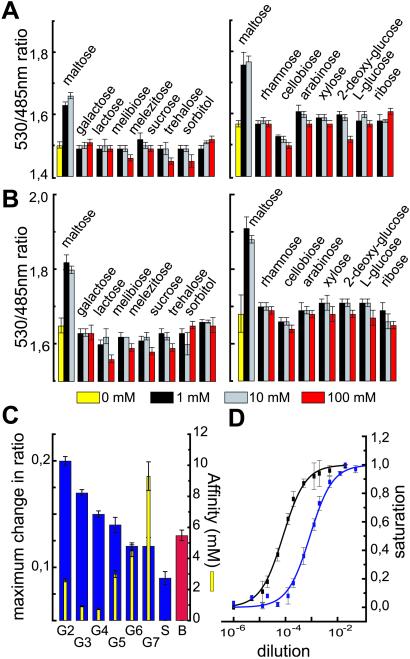
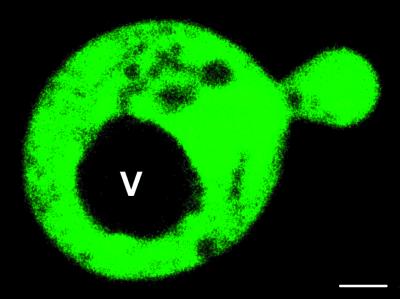
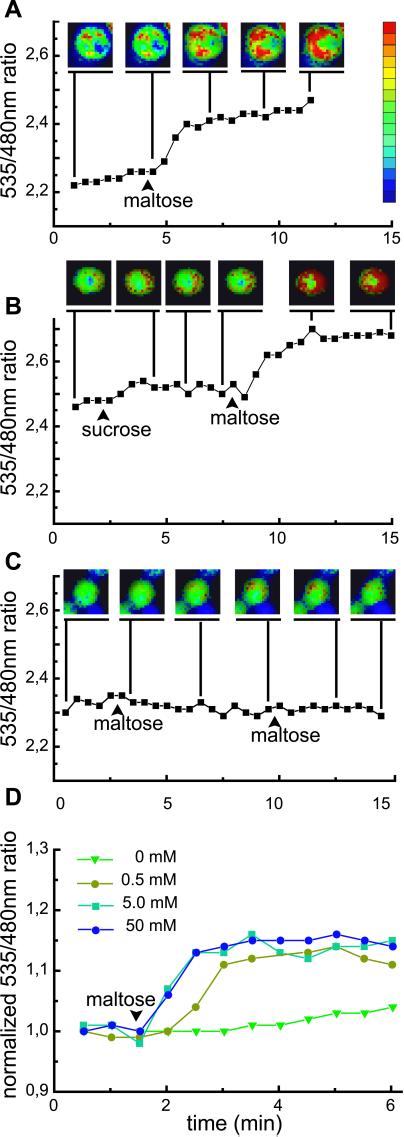
Compartmentation of metabolic reactions and thus transport within and between cells can be understood only if we know subcellular distribution based on nondestructive dynamic monitoring. Currently, methods are not available for in vivo metabolite imaging at cellular or subcellular levels. Limited information derives from methods requiring fixation or fractionation of tissue (1, 2). We thus developed a flexible strategy for designing protein-based nanosensors for a wide spectrum of solutes, allowing analysis of changes in solute concentration in living cells. We made use of bacterial periplasmic binding proteins (PBPs), where we show that, on binding of the substrate, PBPs transform their hinge-bend movement into increased fluorescence resonance energy transfer (FRET) between two coupled green fluorescent proteins. By using the maltose-binding protein as a prototype, nanosensors were constructed allowing in vitro determination of FRET changes in a concentration-dependent fashion. For physiological applications, mutants with different binding affinities were generated, allowing dynamic in vivo imaging of the increase in cytosolic maltose concentration in single yeast cells. Control sensors allow the exclusion of the effect from other cellular or environmental parameters on ratio imaging. Thus the myriad of PBPs recognizing a wide spectrum of different substrates is suitable for FRET-based in vivo detection, providing numerous scientific, medical, and environmental applications.


Figures

Figure 1
Figure 1
Substrate-induced conformational changes. The ECFP donor chromophore was fused to the N terminus of MBP; the EYFP acceptor chromophore was attached to the C terminus. Binding of maltose brings the N and C termini, which are located at the distal ends of the two lobes, respectively, closer together, thereby increasing FRET.
Figure 2
Figure 2
In vitro substrate titrations of purified nanosensors. (A) FLIPmal-2μ: the emission intensity ratio (530/485-nm ratio) increases by 0.2 with increasing maltose concentration. (B) By transforming the maltose-dependent ratio change into saturation of the sensor with maltose, the Kd was determined as 2.3 μM by using nonlinear regression. The saturation curve represents the titration of three independent protein extracts. The range for quantification was defined as the range between 10 and 90% saturation.
Figure 3
Figure 3
Comparison of the substrate specificity of two FLIPmal mutants. The ratio change of purified mutants FLIPmal-2μ (A) and FLIPmal-25μ (B) was tested in the presence of various pentoses, hexoses, sugar alcohols, and di- and trisaccharides at three different concentrations. A significant increase in ratio was observed only in the presence of maltose. (C) The maximum change in ratio (Left) and the affinity constant (Right) of FLIPmal-2μ was analyzed in the presence of different MOS, soluble starch, and beer. The maximum change in ratio decreased with increasing chain length, whereas the Kd remained similar. (D) Purified FLIPmal-2μ (black) and FLIPmal-25μ (blue) were titrated with different dilutions of beer. The dilution at half saturation equals the Kd and can be used to determine the maltose concentration.
Figure 4
Figure 4
Confocal imaging of FLIPmal-25μ expressed in yeast. FLIPmal-25μ is detected in the cytosol, whereas no signal was found in the vacuole (V). (Bar = 1 μm.)
Figure 5
Figure 5
Visualizing dynamic maltose concentration change in the cytosol of yeast. (A, B) SuSy7/ura3 expressing StSUT1 for maltose uptake into the cytosol and FLIPmal-25μ (A, n = 32; B, n = 43). Each graph indicates the emission intensity ratio (535/480-nm ratio) for a single yeast cell. Addition of maltose increased the ratio by 0.15 to 0.2, whereas addition of sucrose had no effect on the emission intensity ratio. (C) SuSy7/ura3 expressing StSUT1 and FLIPmal-control. Addition of extracellular maltose or sucrose did not increase the ratio (n = 19). Yeast images are pseudocolored to demonstrate the ratio change. Extracellular sugar solutions were added at the indicated time points at a final concentration of 50 mM (arrowhead). (D) EBY4000 strain: each graph indicates the average emission intensity ratio of four to seven cells. Addition of low levels of maltose (0.5 mM, olive) led to a retarded change in ratio as compared with higher levels (5 mM, aqua; 50 mM, blue); no change was observed with addition of water (green).

Comment in

References

    1. Farré E M, Tiessen A, Roessner U, Geigenberger P, Trethewey R N, Willmitzer L. Plant Physiol. 2001;127:685–700. - PMC - PubMed
    1. Borisjuk L, Walenta S, Weber H, Müller-Klieser W, Wobus U. Plant J. 1998;15:583–591. - PubMed
    1. Nikaido H. FEBS Lett. 1994;346:55–58. - PubMed
    1. Vyas N K, Vyas M N, Quiocho F A. Science. 1988;242:1290–1295. - PubMed
    1. Scharff A J, Rodseth L E, Spurlino J C, Quiocho F A. Biochemistry. 1992;31:10657–10663. - PubMed

Publication types

MeSH terms