

Leaf structural and photosynthetic characteristics, and biomass allocation to foliage in relation to foliar nitrogen content and tree size in three Betula species
- PMID: 12099350
- PMCID: PMC4233790
- DOI: 10.1093/aob/mcf025
Leaf structural and photosynthetic characteristics, and biomass allocation to foliage in relation to foliar nitrogen content and tree size in three Betula species
Abstract
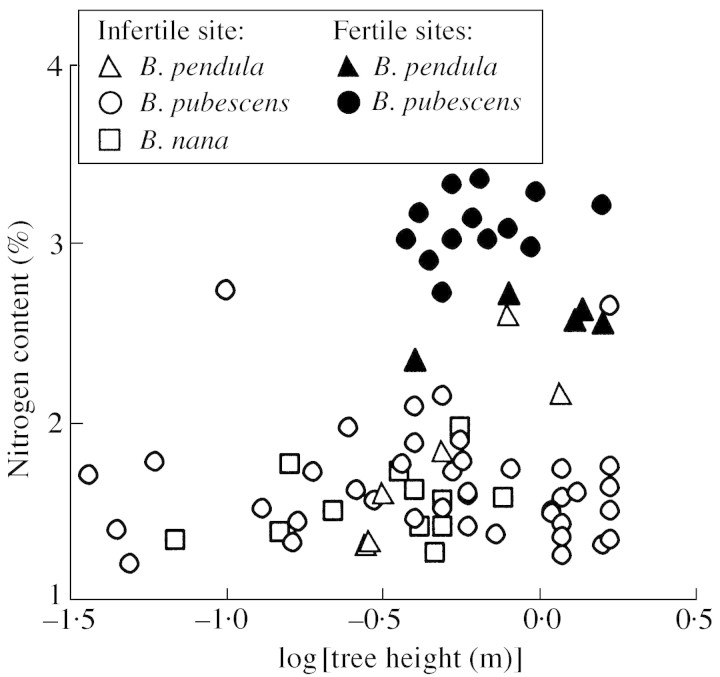
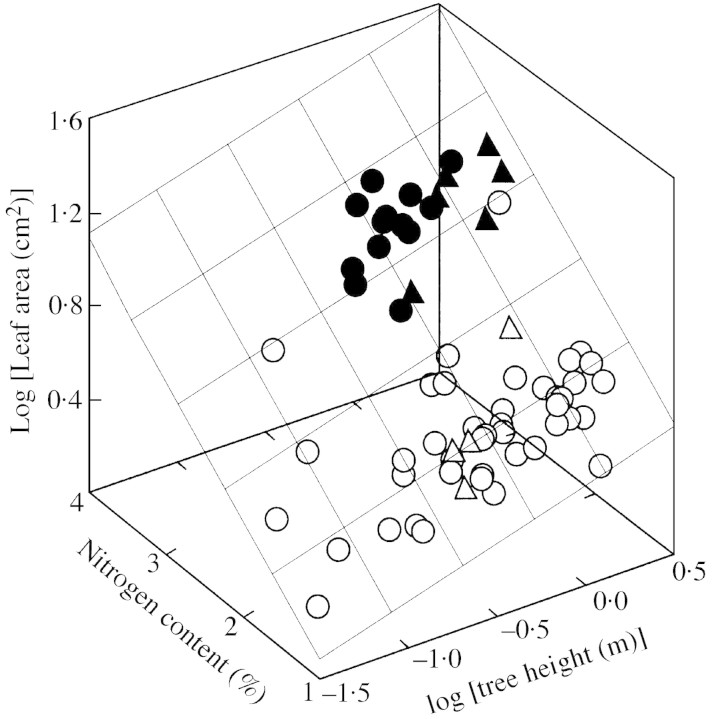
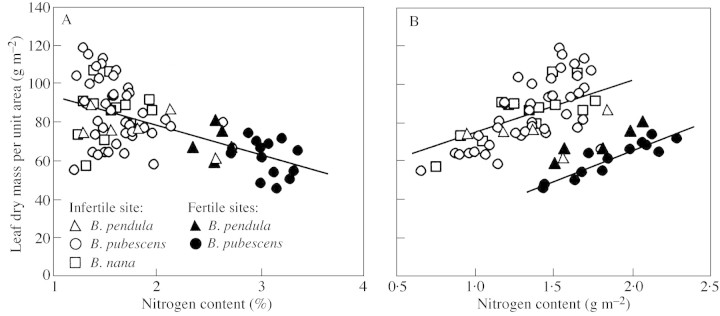
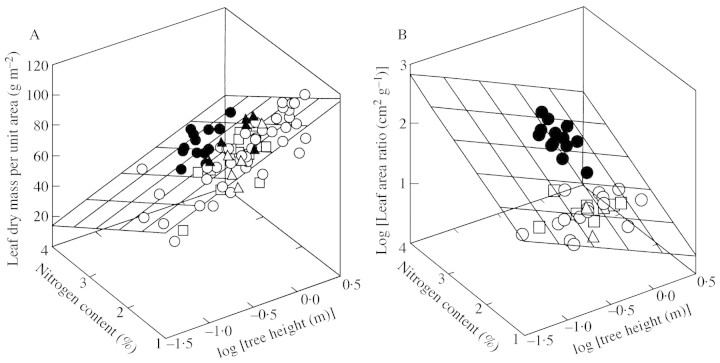
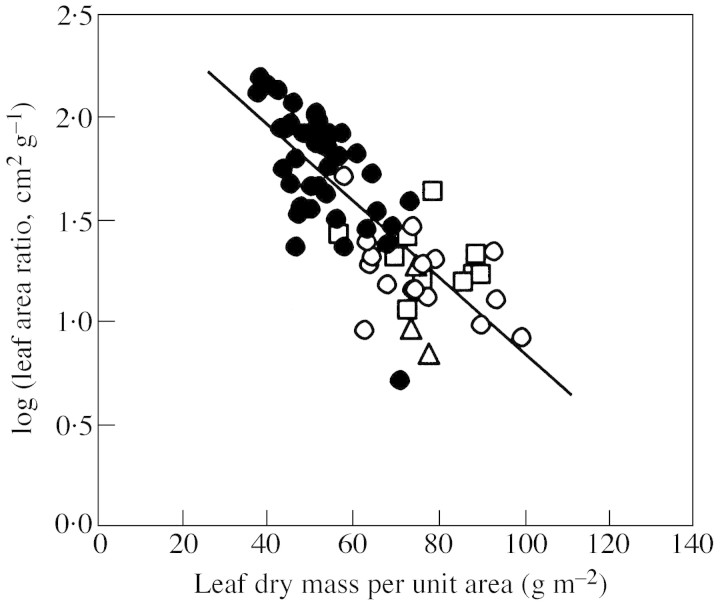
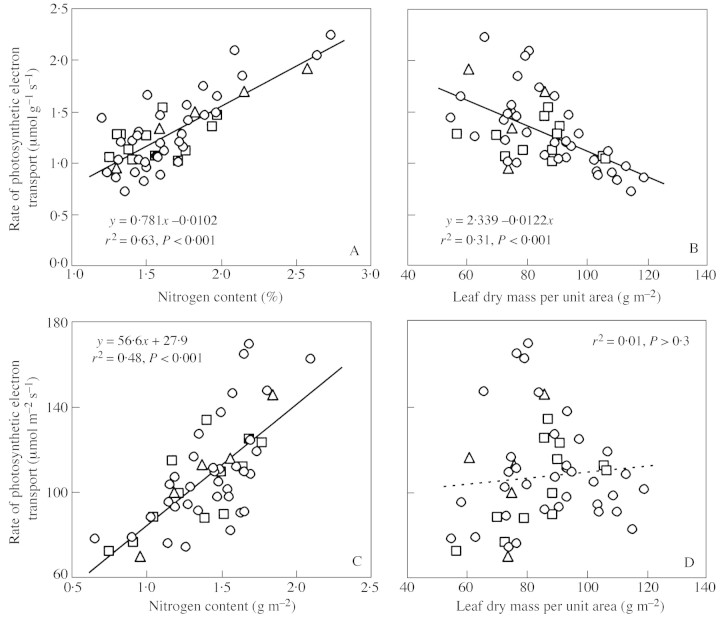
Young trees 0.03-1.7 m high of three coexisting Betula species were investigated in four sites of varying soil fertility, but all in full daylight, to separate nutrient and plant size controls on leaf dry mass per unit area (MA), light-saturated foliar photosynthetic electron transport rate (J) and the fraction of plant biomass in foliage (F(L)). Because the site effect was generally non-significant in the analyses of variance with foliar nitrogen content per unit dry mass (N(M)) as a covariate, N(M) was used as an explaining variable of leaf structural and physiological characteristics. Average leaf area (S) and dry mass per leaf scaled positively with N(M) and total tree height (H) in all species. Leaf dry mass per unit area also increased with increasing H, but decreased with increasing N(M), whereas the effects were species-specific. Increases in plant size led to a lower and increases in N(M) to a greater FL and total plant foliar area per unit plant biomass (LAR). Thus, the self-shading probably increased with increasing N(M) and decreased with increasing H. Nevertheless, the whole-plant average M(A), as well as M(A) values of topmost fully exposed leaves, correlated with N(M) and H in a similar manner, indicating that scaling of MA with N(M) and H did not necessarily result from the modified degree of within-plant shading. The rate of photosynthetic electron transport per unit dry mass (J(M)) scaled positively with N(M), but decreased with increasing H and M(A). Thus, increases in M(A) with tree height and decreasing nitrogen content not only resulted in a lower plant foliar area (LAR = F(L)/M(A)), but also led to lower physiological activity of unit foliar biomass. The leaf parameters (J(M), N(M) and M(A)) varied threefold, but the whole-plant characteristic FL varied 20-fold and LAR 30-fold, indicating that the biomass allocation was more plastically adjusted to different plant internal nitrogen contents and to tree height than the foliar variables. Our results demonstrate that: (1) tree height and N(M) may independently control foliar structure and physiology, and have an even greater impact on biomass allocation; and (2) the modified within-plant light availabilities alone do not explain the observed patterns. Although there were interspecific differences with respect to the statistical significance of the relationships, all species generally fit common regressions. However, these differences were consistent, and suggested that more competitive species with inherently larger growth rates also more plastically respond to N and H.
Figures
Similar articles
-
Stomatal conductance alone does not explain the decline in foliar photosynthetic rates with increasing tree age and size in Picea abies and Pinus sylvestris.Tree Physiol. 2002 Jun;22(8):515-35. doi: 10.1093/treephys/22.8.515. Tree Physiol. 2002. PMID: 12045025
-
Coordination of crown structure, leaf plasticity and carbon gain within the crowns of three winter-deciduous mature trees.Tree Physiol. 2006 May;26(5):633-41. doi: 10.1093/treephys/26.5.633. Tree Physiol. 2006. PMID: 16452077
-
Complex adjustments of photosynthetic potentials and internal diffusion conductance to current and previous light availabilities and leaf age in Mediterranean evergreen species Quercus ilex.Plant Cell Environ. 2006 Jun;29(6):1159-78. doi: 10.1111/j.1365-3040.2006.01499.x. Plant Cell Environ. 2006. PMID: 17080941
-
Photosynthesis and resource distribution through plant canopies.Plant Cell Environ. 2007 Sep;30(9):1052-71. doi: 10.1111/j.1365-3040.2007.01683.x. Plant Cell Environ. 2007. PMID: 17661747 Review.
-
Variation in leaf photosynthetic capacity within plant canopies: optimization, structural, and physiological constraints and inefficiencies.Photosynth Res. 2023 Nov;158(2):131-149. doi: 10.1007/s11120-023-01043-9. Epub 2023 Aug 24. Photosynth Res. 2023. PMID: 37615905 Review.
Cited by
-
Intraspecific relationships among wood density, leaf structural traits and environment in four co-occurring species of Nothofagus in New Zealand.PLoS One. 2013;8(3):e58878. doi: 10.1371/journal.pone.0058878. Epub 2013 Mar 18. PLoS One. 2013. PMID: 23527041 Free PMC article.
-
Twenty-two years of warming, fertilisation and shading of subarctic heath shrubs promote secondary growth and plasticity but not primary growth.PLoS One. 2012;7(4):e34842. doi: 10.1371/journal.pone.0034842. Epub 2012 Apr 12. PLoS One. 2012. PMID: 22511968 Free PMC article.
-
High nitrogen inhibits biomass and saponins accumulation in a medicinal plant Panax notoginseng.PeerJ. 2023 Feb 21;11:e14933. doi: 10.7717/peerj.14933. eCollection 2023. PeerJ. 2023. PMID: 36846464 Free PMC article.
-
Application of leaf size and leafing intensity scaling across subtropical trees.Ecol Evol. 2020 Nov 12;10(23):13395-13402. doi: 10.1002/ece3.6943. eCollection 2020 Dec. Ecol Evol. 2020. PMID: 33304546 Free PMC article.
-
Safety-efficiency tradeoffs? Correlations of photosynthesis, leaf hydraulics, and dehydration tolerance across species.Oecologia. 2022 Oct;200(1-2):51-64. doi: 10.1007/s00442-022-05250-4. Epub 2022 Aug 30. Oecologia. 2022. PMID: 36040668
References
-
- AckerlyDD, Bazzaz FA.1995. Leaf dynamics, self‐shading and carbon gain in seedlings of a tropical pioneer tree. Oecologia 101: 289–298. - PubMed
-
- AckerlyDD, Reich PB.1999. Convergence and correlations among leaf size and function in seed plants: a comparative test using independent contrasts. American Journal of Botany 86: 1272–1281. - PubMed
-
- AtkinsonMD.1992. Biological flora of the British Isles No. 175. Betula pendula Roth. (B. verrucosa Ehrh.) and B. pubescens Ehrh. Journal of Ecology 80: 837–870.
-
- BowlerJM, Press MC.1996. Effects of elevated CO2, nitrogen form and concentration on growth and photosynthesis of a fast‐ and slow‐growing grass. The New Phytologist 132: 391–401. - PubMed
-
- ChapinFSIII.1989. The cost of tundra plant structures: evaluation of concepts and currencies. The American Naturalist 133: 1–19.
Publication types
MeSH terms
Substances
LinkOut - more resources
Full Text Sources
Molecular Biology Databases
Miscellaneous
