Comparative Study
. 2002 Jun;88(3):521-35.
doi: 10.1645/0022-3395(2002)088[0521:PVBSD]2.0.CO;2.

Plasmodium vivax blood-stage dynamics

Affiliations
Comparative Study

Plasmodium vivax blood-stage dynamics

F Ellis McKenzie et al. J Parasitol. 2002 Jun.

Abstract

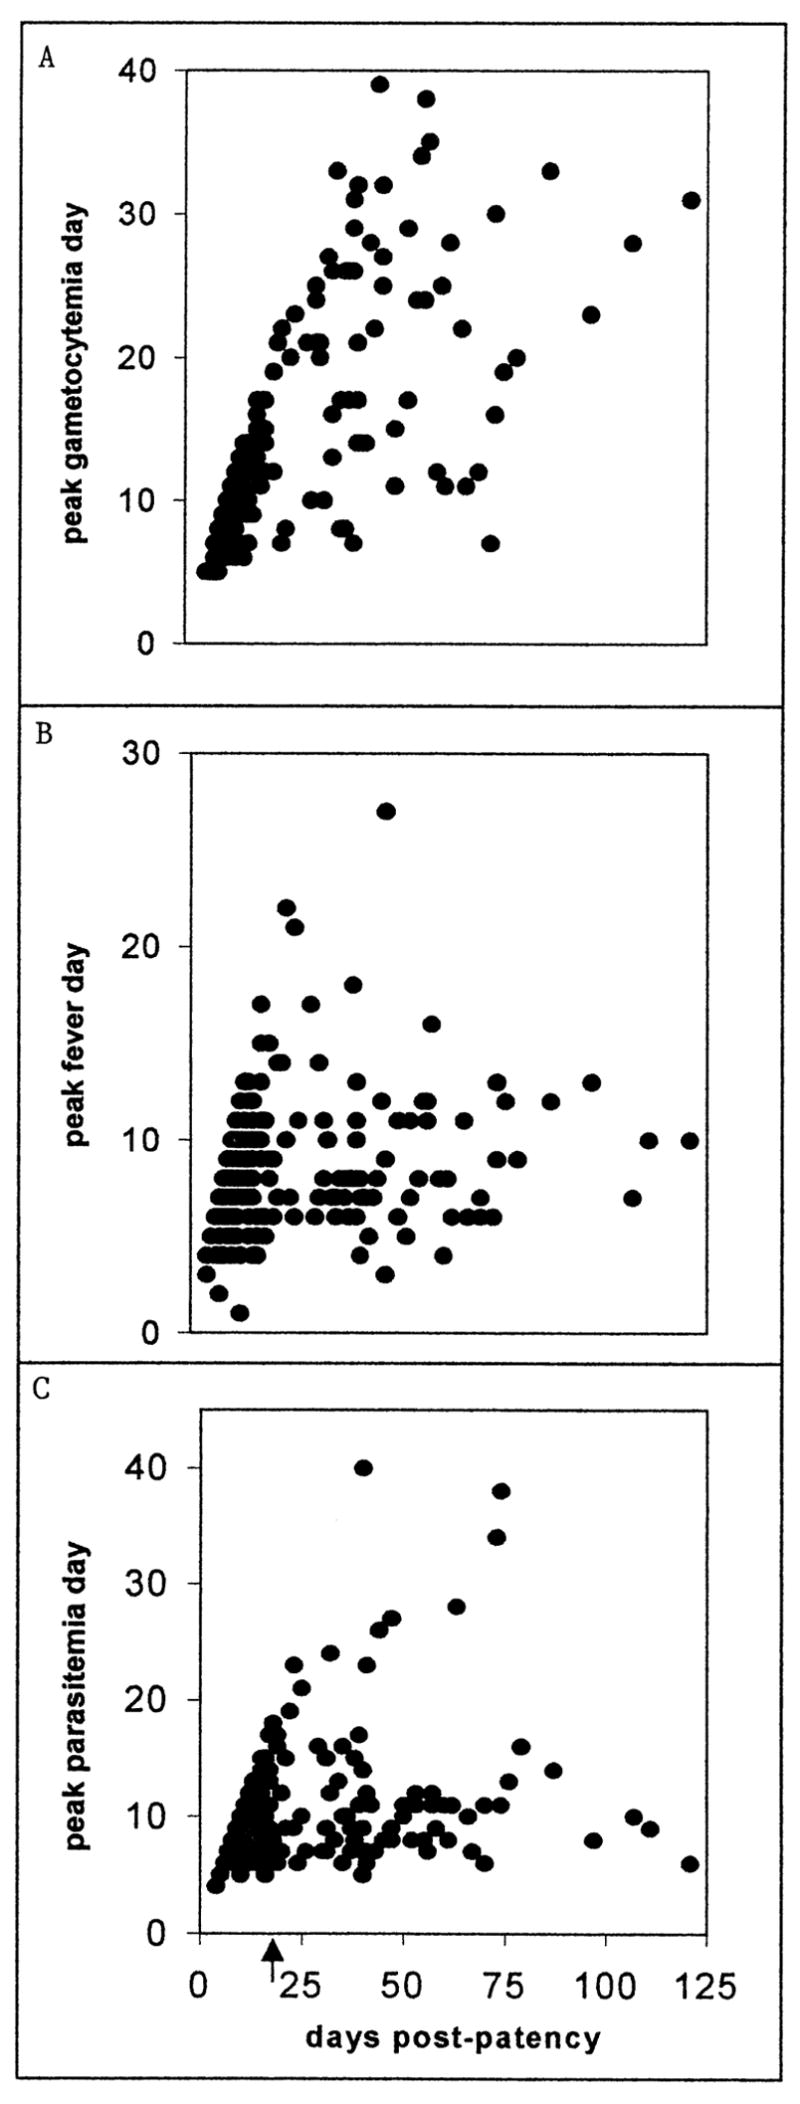
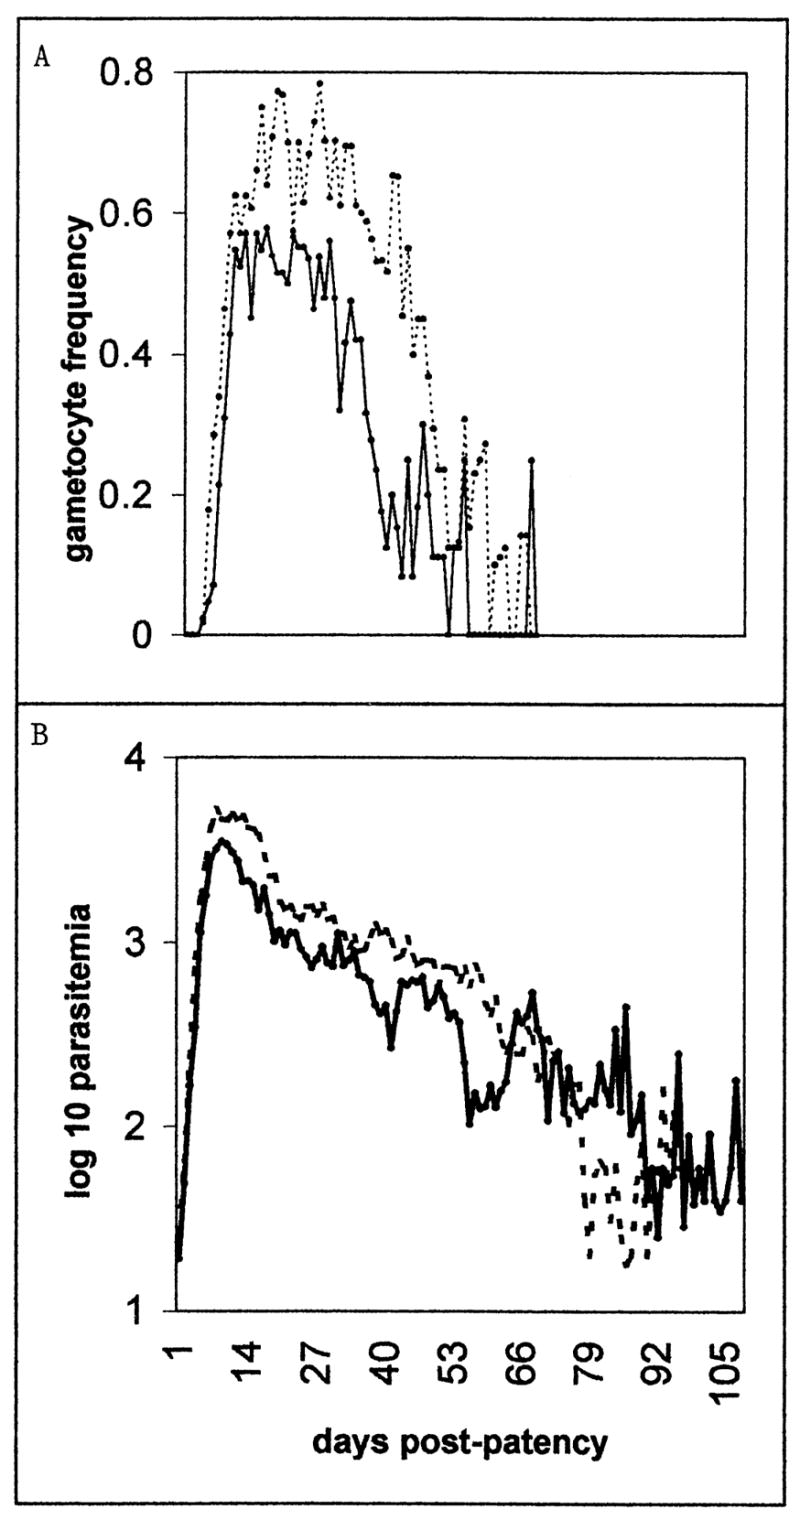
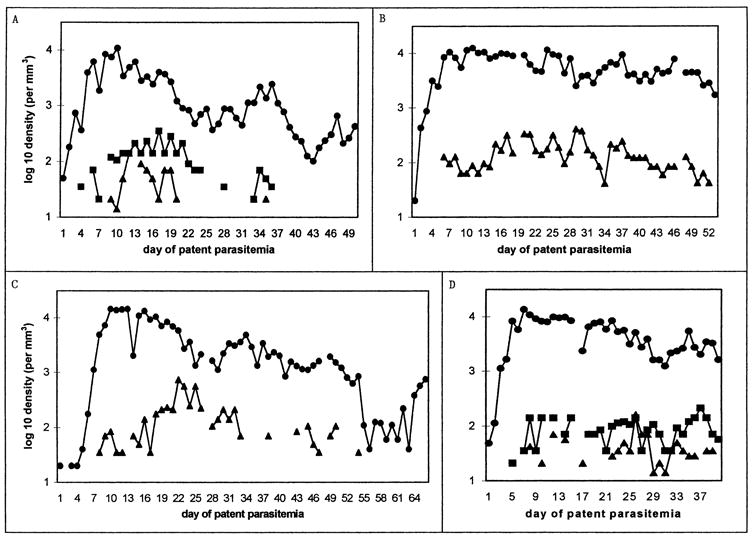
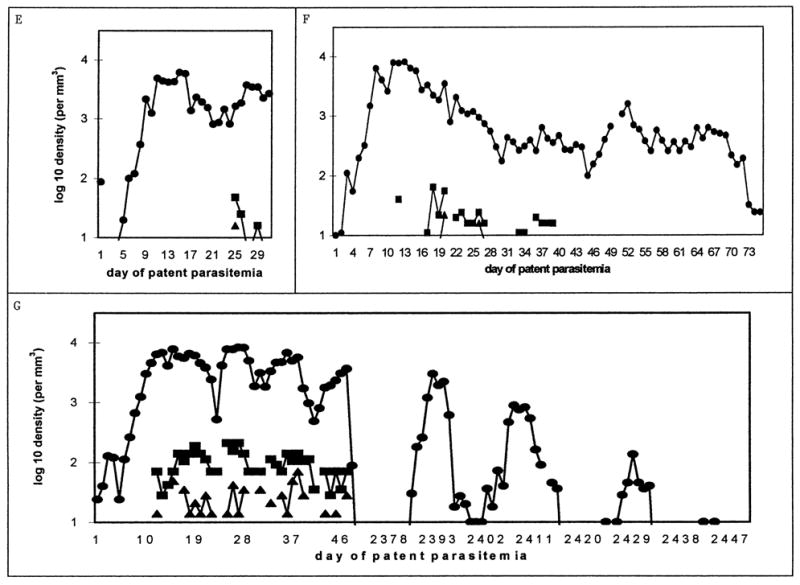
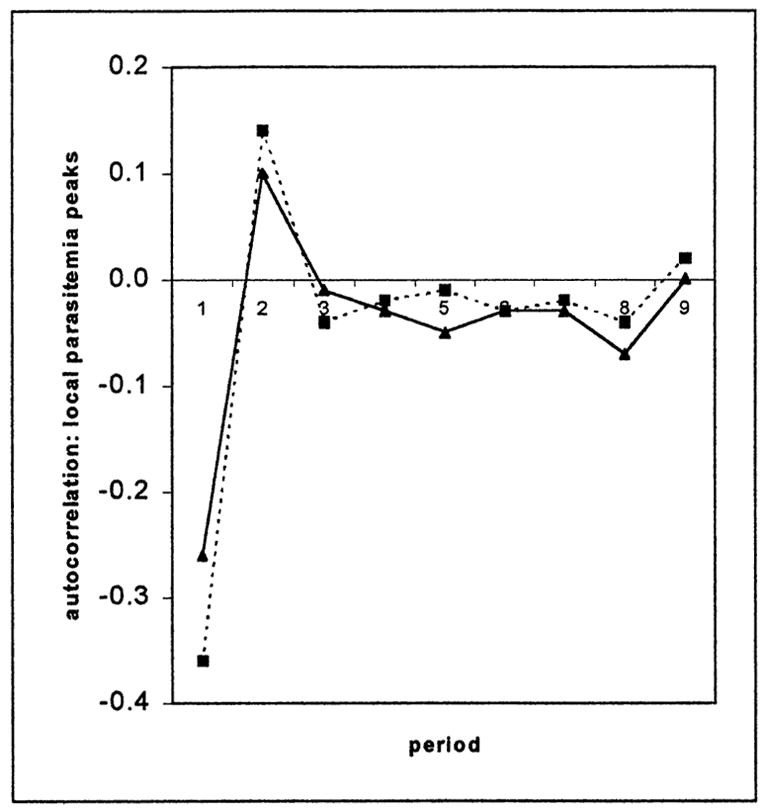
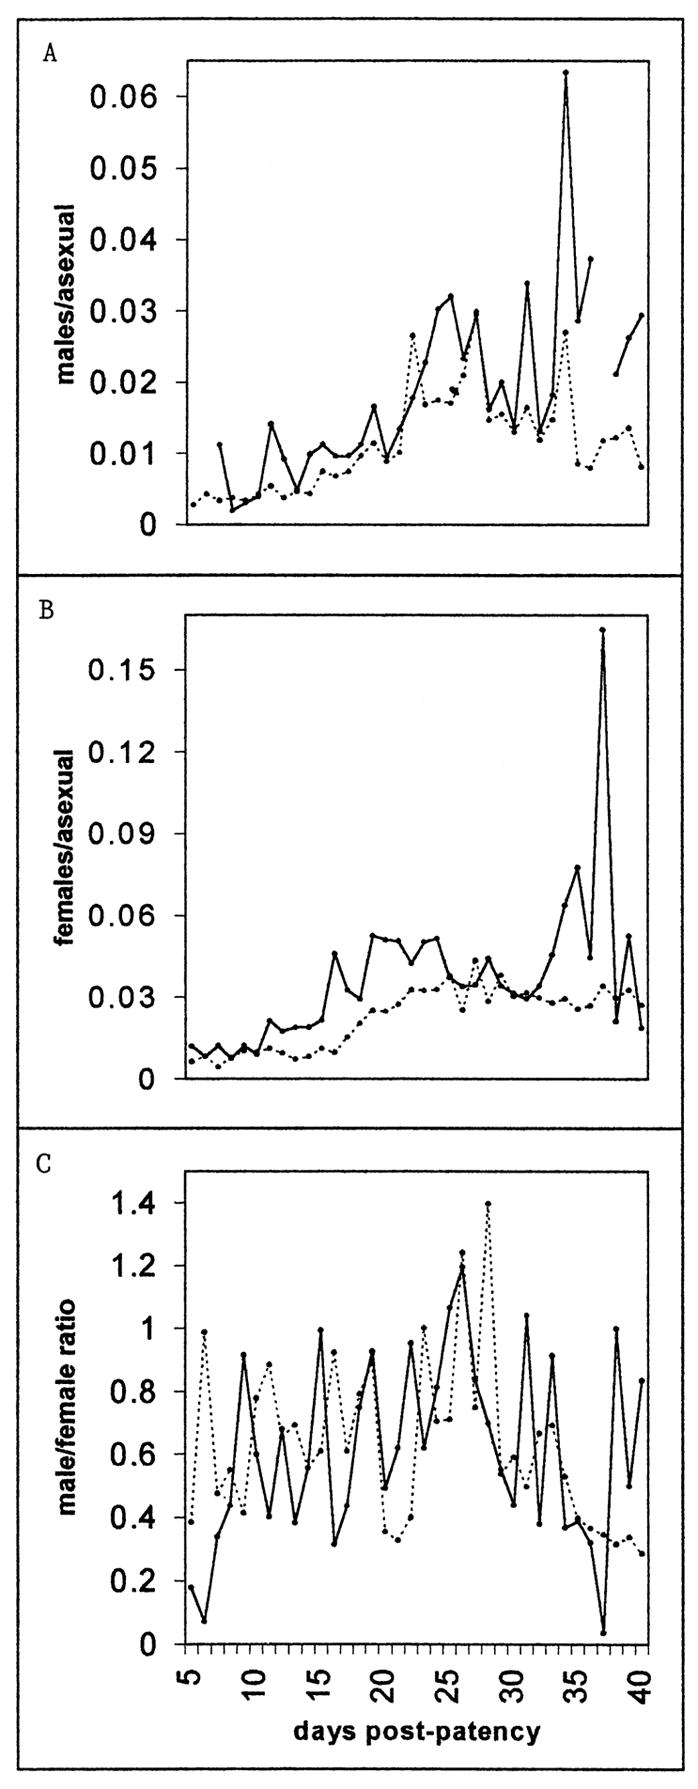
We examine the dynamics of parasitemia and gametocytemia reflected in the preintervention charts of 221 malaria-naive U.S. neurosyphilis patients infected with the St. Elizabeth strain of Plasmodium vivax, for malariatherapy, focusing on the 109 charts for which 15 or more days of patency preceded intervention and daily records encompassed an average 98% of the duration of each infection. Our approximations of merogony cycles (via "local peaks" in parasitemia) seldom fit patterns that correspond to "textbook" tertian brood structures. Peak parasitemia was higher in trophozoite-induced infections than in sporozoite-induced ones. Relative densities of male and female gametocytes appeared to alternate, though without a discernably regular period. Successful transmission to mosquitoes did not depend on detectable gametocytemia or on absence of fever. When gametocytes were detected, transmission success depended on densities of only male gametocytes. Successful feeds occurred on average 4.7 days later in an infection than did failures. Parasitemia was lower in homologous reinfection, gametocytemia lower or absent.


Figures

Figure 1
Figure 1
The day of patent infection on which the peak gametocyte density (A), peak fever (B), and peak asexual-form density (C) occurred (vertical axes) plotted against the overall number of days of patent infection before intervention in the corresponding individual chart (horizontal axis). The arrow indicates day 14 of patency (see text).
Figure 2
Figure 2
Patent gametocyte frequency (A, binary) and asexual-form density (B, as the mean of the log 10 parasitemia) for each day of patent, preintervention infection in charts with more than 14 days of observed preintervention patency. The solid line represents sporozoite-induced infections, the dotted line trophozoite-induced infections.
Figure 3
Figure 3
Examples of charts with more than 14 days of preintervention patency. For each chart, the line graph shows log 10 parasitemia (as circles) and gametocytemia (males as triangles, females as squares) per cubic millimeter of blood, plotted from the first day of patent parasitemia to the last day before intervention. Patient identification numbers and days plotted are (A) S-611, 50 days; (B) S-554, 53 days; (C) S-533, 66 days; (D) S-757, 40 days; (E) S-1084, 31 days; (F) S-932, 76 days; (G) S-772, 50 and 60 days (see following text). Single tertian intervals between “local peaks” in parasitemia are most evident in B (days 35–43) and D (days 20–28). Note that only males were reported in B and C (see text). The patient in part G was treated with atabrine (1 g on day 47, 400 mg daily on days 48–53) and reinoculated with St. Elizabeth P. vivax 76 mo later.
Figure 3
Figure 3
Examples of charts with more than 14 days of preintervention patency. For each chart, the line graph shows log 10 parasitemia (as circles) and gametocytemia (males as triangles, females as squares) per cubic millimeter of blood, plotted from the first day of patent parasitemia to the last day before intervention. Patient identification numbers and days plotted are (A) S-611, 50 days; (B) S-554, 53 days; (C) S-533, 66 days; (D) S-757, 40 days; (E) S-1084, 31 days; (F) S-932, 76 days; (G) S-772, 50 and 60 days (see following text). Single tertian intervals between “local peaks” in parasitemia are most evident in B (days 35–43) and D (days 20–28). Note that only males were reported in B and C (see text). The patient in part G was treated with atabrine (1 g on day 47, 400 mg daily on days 48–53) and reinoculated with St. Elizabeth P. vivax 76 mo later.
Figure 4
Figure 4
The correlogram of local peaks in parasitemia (binary) in the patient charts with ≥4 local peaks. The solid line represents sporozoite-induced infections, the dotted line trophozoite-induced infections.
Figure 5
Figure 5
The day-by-day course of the mean male (A) and female (B) gametocytemia per asexual form and the gametocyte sex ratio (C) between days 5 and 40 of patency. Only charts in which each gametocyte sex was reported on at least 1 day were included; charts in which the sex ratio exceeded 10 were excluded (4 charts, on a total of 11 days). If the density of only 1 sex was recorded on a given day, the density of the other on that day was set at 5 mm−3 (the threshold of detection was roughly 10 mm−3). The solid line represents sporozoite-induced infections, the dotted line trophozoite-induced infections.

References

    1. Adak T, Kaur S, Singh OP. Comparative susceptibility of different members of the Anopheles culifacies complex to Plasmodium vivax. Transactions of the Royal Society of Tropical Medicine and Hygiene. 1999;93:573–577. - PubMed
    1. Basu BC. The frequency of distribution of gametocytes of the Indian strains of malaria parasites. Indian Journal of Malariology. 1947;1:123–127.
    1. Boyd MF. The threshold of parasite density in relation to clinical activity in primary infections with Plasmodium vivax. American Journal of Tropical Medicine. 1938;18:497–503.
    1. Boyd MF. On strains or races of the malaria parasites. American Journal of Tropical Medicine. 1940a;20:69–80.
    1. Boyd MF. Some characteristics of artificially induced vivax malaria. American Journal of Tropical Medicine. 1940b;20:269–278.

Publication types