. 2002;12(3):291-303.
doi: 10.1002/hipo.1112.

Hippocampal spatial representations require vestibular input

Affiliations

Hippocampal spatial representations require vestibular input

Robert W Stackman et al. Hippocampus. 2002.

Abstract

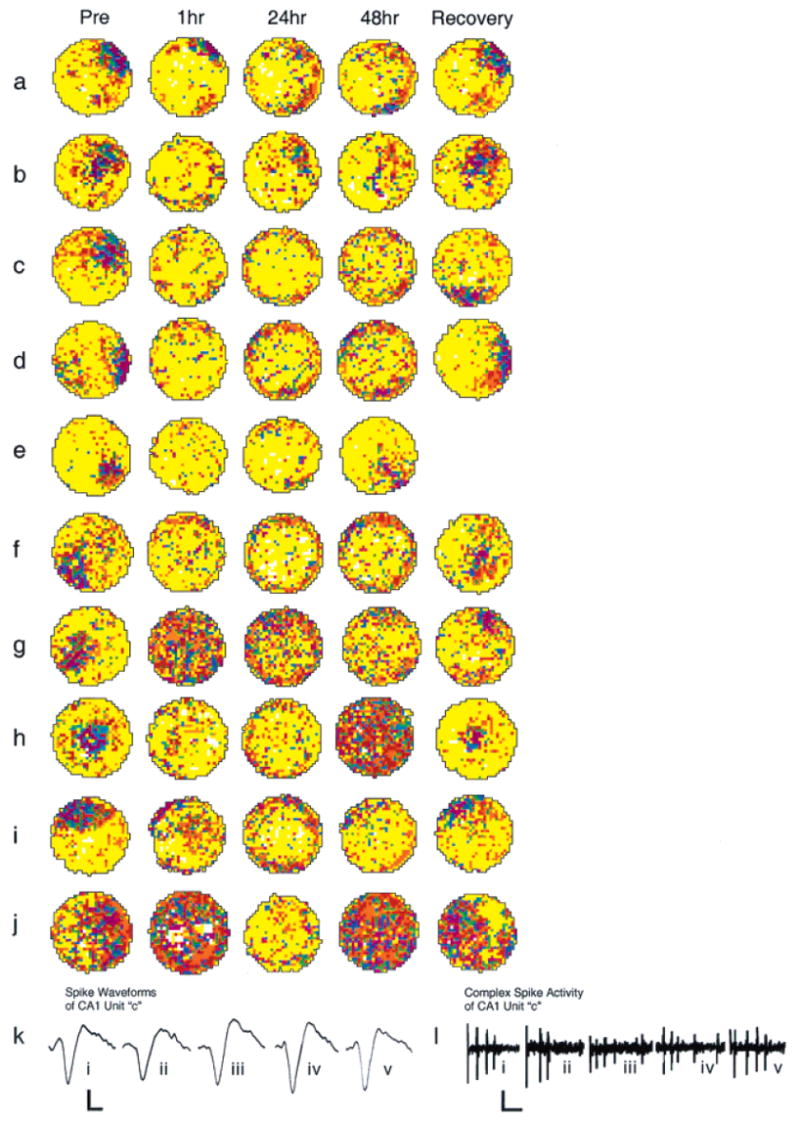
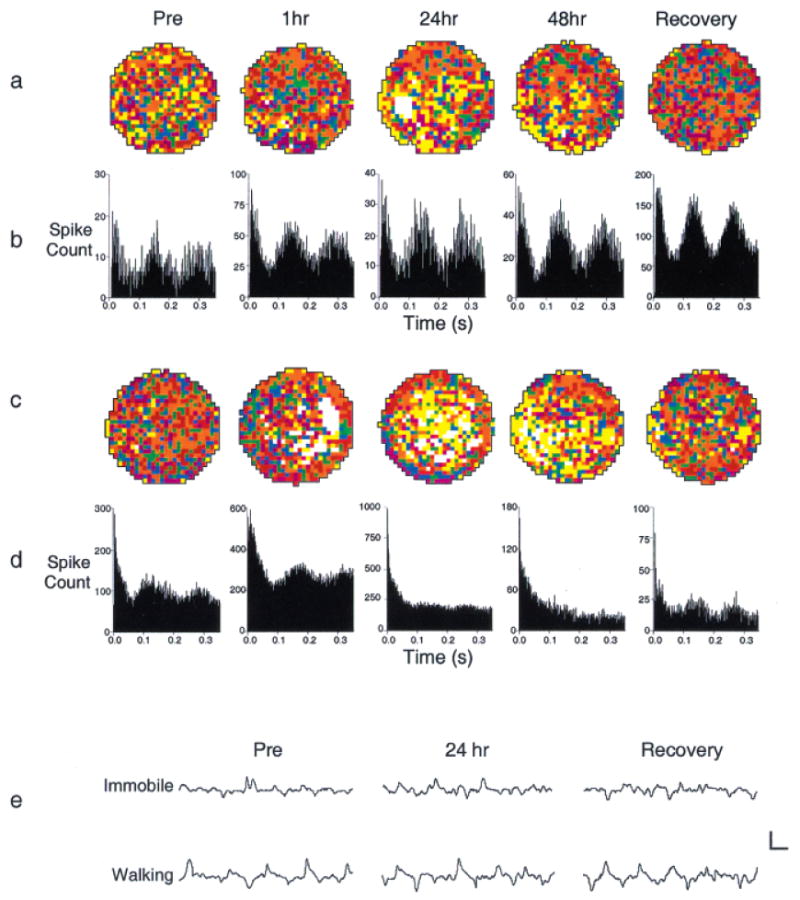
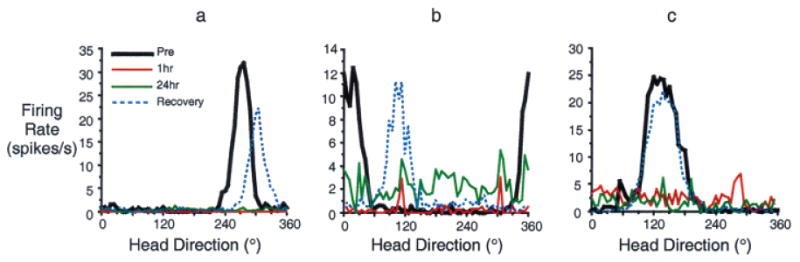
The hippocampal formation is essential for forming declarative representations of the relationships among multiple stimuli. The rodent hippocampal formation, including the entorhinal cortex and subicular complex, is critical for spatial memory. Two classes of hippocampal neurons fire in relation to spatial features. Place cells collectively map spatial locations, with each cell firing only when the animal occupies that cell's "place field," a particular subregion of the larger environment. Head direction (HD) cells encode directional heading, with each HD cell firing when the rat's head is oriented in that cell's particular "preferred firing direction." Both landmarks and internal cues (e.g., vestibular, motor efference copy) influence place and HD cell activity. However, as is the case for navigation, landmarks are believed to exert greater influence over place and HD cell activity. Here we show that temporary inactivation of the vestibular system led to the disruption of location-specific firing in hippocampal place cells and direction-specific discharge of postsubicular HD cells, without altering motor function. Place and HD cell activity recovered over a time course similar to that of the restoration of vestibular function. These results indicate that vestibular signals provide an important influence over the expression of hippocampal spatial representations, and may explain the navigational deficits of humans with vestibular dysfunction.


Figures

FIGURE 1
FIGURE 1
Vestibular inactivation disrupts location-specific firing in hippocampal place cells: examples of firing fields of all 10 cells recorded, before and after inactivation of the vestibular apparatus. a–j: For each map, increasing rates of discharge are coded from yellow, orange, red, green, blue, and purple, with yellow pixels depicting locations visited where no spikes were fired. Pixels that were never visited during the recording session are coded white. Each map was autoscaled such that the number of pixels in the next higher firing rate category was equal to 0.8 times the number of pixels in the lower firing rate category (Muller et al., 1987). For each example, Pre depicts activity recorded during the baseline session; postinjection activity is depicted in the remaining plots under the headings 1 hr, 24 hr, 48 hr, and Recovery. In each case, Recovery represents that activity acquired during the recording session at which vestibular function was judged as restored. Respective recovery time points for each cell were as follows: a, 60 h; b, 72 h; c, 60 h; d, 72 h; e, 48 h; f, 72 h; g, 60 h; h, 96 h; i, 72 h; and j, 72 h. k: Unit waveform traces acquired during recording the cell depicted in c, at each of the time points before and after vestibular inactivation (i–v: Pre; Post 1 hr; 24 hr; 48 hr; and Recovery). The calibration scale represents 50 μV/200 μs. l: Representative spike trace records depicting complex spike activity of the cell depicted in c, acquired at each of the time points before and after vestibular inactivation (i–v: Pre; Post 1 hr; 24 hr; 48 hr; and Recovery). Calibration scale represents 50 μV/10 ms.
FIGURE 2
FIGURE 2
a: Vestibular inactivation disrupts spatial selectivity of firing of CA1 neurons: mean place field spatial coherence computed at each time point before and after vestibular inactivation for all 10 place cells. Asterisks indicate time points that were significantly different from Pre baseline, P < 0.05, Fisher’s PLSD test. b: Vestibular inactivation causes transient depression of locomotor activity: mean cumulative distance (in cm) traveled in the cylinder during each 16-min recording session at each time point before and after vestibular inactivation. Measures of speed of locomotion reflected a similar decrease at 1 h postinjection and full recovery within 24 h. Asterisk indicates time point that was significantly different from Pre baseline, P < 0.05, Fisher’s PLSD test. c: Relative distribution of consequences to place field location upon recovery from vestibular inactivation, as compared to place field location during baseline recording sessions. Place fields were observed to: remain in a position consistent with baseline session (No Shift); undergo an angular shift in position (Angular Shift); undergo a radial shift in position (Radial Shift); or undergo both an angular and radial shift in position (Full Remapping).
FIGURE 3
FIGURE 3
Representative examples of hippocampal theta cell activity recorded before and after vestibular inactivation. a, c: Place by firing rate plots reveal minimal alteration in location-specific firing over the course of vestibular inactivation. Spatial coherence values for these cells at baseline and recovery were as follows: a, 0.243 and 0.487; c, 0.200 and 0.205, respectively. b, d: Respective autocorrelation functions observed for the cells plotted in a and c. The autocorrelation function represents the measure of cell firing at each 1 msec interval (from 0 –350 msec), given a spike discharge at time 0. Autocorrelation functions were constructed by normalizing the spike count for each interval with respect to its peak value. The plot of the theta cell shown in b illustrates a preservation of rhythmic discharge over the course of inactivation, while the plot of the cell shown in d indicates a diminution of rhythmic discharge at 24 h and 48 h postinjection. e: Representative 1-s hippocampal EEG traces are depicted for the cell plotted in a, taken at each of the three time points indicated. Upper traces (Immobile) illustrate the EEG when the rat was stationary. In this case, voltage amplitude was decreased and theta rhythm was not evident. Lower traces (Walking) illustrate the EEG during episodes of locomotion when voltage amplitude was increased and theta rhythmicity was observed. Similar patterns of activity were reflected in EEG traces taken during and following vestibular inactivation; however, traces taken at 24 h suggest a slight irregularity in theta frequency over the course of the 1-sec trace. The calibration scale represents 2 mV/100 ms.
FIGURE 4
FIGURE 4
Examples of firing rate by HD tuning curves of three postsubicular HD cells recorded from three different rats, before and after inactivation of the vestibular apparatus. For each cell, the baseline activity, or Pre, is represented by a heavy black line. The remaining lines illustrate the postinjection time course of inactivation: red, 1 h; green, 24 h; and blue, vestibular recovery, namely, a, 48 h; b, 72 h; and c, 72 h. For all three cells, directional discharge was abolished by 1 h postinjection. Upon recovery of vestibular function, two HD cells exhibited a marked shift in preferred firing direction as compared to the baseline session. Cross-correlation analyses of baseline vs. recovery session activity determined that the preferred firing direction of the cell in a shifted by 30°, the preferred firing direction of the cell in b shifted by 96°, and the preferred firing direction of the cell in c did not shift upon recovery.

References

    1. Archey WB, Stackman RW, Goodridge JP, Dudchenko PA, Taube JS. Place cells show directionality in an open field following lesions of the head direction cell system. Soc Neurosci Abstr. 1997;23:504.
    1. Ballesteros MA, Gallo M. Bilateral tetrodotoxin blockade of the rat vestibular nuclei substitutes the natural unconditioned stimulus in taste aversion learning. Neurosci Lett. 2000;279:161–164. - PubMed
    1. Beitz AJ, Saxon DW, Anderson JH. Development of a novel, reversible labyrinthectomy model: behavioral and anatomical correlates. Soc Neurosci Abstr. 1995;21:919.
    1. Beritoff JS. Neural mechanisms of higher vertebrate behavior. Boston: Little, Brown and Co; 1966.
    1. Blair HT, Sharp PE. Visual and vestibular influences on head-direction cells in the anterior thalamus of the rat. Behav Neurosci. 1996;110:643– 660. - PubMed

Publication types