On the conservative nature of the leaf mass-area relationship
- PMID: 12099526
- PMCID: PMC4233902
- DOI: 10.1093/aob/mcf100
On the conservative nature of the leaf mass-area relationship
Abstract
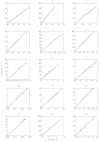
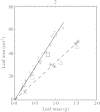
In a previous empirical study, Hughes and colleagues showed that for several herbaceous species there is apparently a unique species-specific relationship between the area and mass of leaves. We tested this proposition using measurements from 15 broad-leaved species. We found that to a reasonable approximation, leaf area was proportional to leaf mass within a given species despite relatively large variations in both leaf thickness and the mass fraction of liquid matter. These observations show that the inverse density-thickness of leaves from a given species, which we call the Hughes constant, is approximately conserved. We conclude that the Hughes constant is likely to be more conservative than other traits traditionally used to describe leaves.
Figures


References
-
- CornelissenJHC, Werger MJA, Castro‐Diez P, van Rheenen JWA, Rowland AP.1997. Foliar nutrients in relation to growth, allocation and leaf traits in seedlings of a wide range of woody plant species and types. Oecologia 111: 460–469. - PubMed
-
- GarnierE, Laurent G.1994. Leaf anatomy, specific mass and water content in congeneric annual and perennial grass species. New Phytologist 128: 725–736.
-
- GarnierE, Shipley B, Roumet C, Laurent G.2001. A standardized protocol for the determination of specific leaf area and leaf dry matter content. Functional Ecology 15: 688–695.
-
- HughesAP, Cockshull KE, Heath OVS.1970. Leaf area and absolute leaf water content. Annals of Botany 34: 259–265.
-
- RoderickML.2001. On the use of thermodynamic methods to describe water relations in plants and soil. Australian Journal of Plant Physiology 28: 729–742.
Publication types
MeSH terms
LinkOut - more resources
Full Text Sources
Molecular Biology Databases
Miscellaneous

