. 2002 Jul;129(1):125-32.
doi: 10.1046/j.1365-2249.2002.01830.x.

Deficiencies in CD4+ and CD8+ T cell subsets in ataxia telangiectasia

Affiliations

Deficiencies in CD4+ and CD8+ T cell subsets in ataxia telangiectasia

R Schubert et al. Clin Exp Immunol. 2002 Jul.

Abstract

Chronic sinopulmonary infections that are associated with immunodeficiency are one of the leading causes of death in the multi-systemic disease ataxia telangiectasia (AT). Immunological investigations of AT patients revealed a broad spectrum of defects in the humoral and the cellular immune system. Based on their important role in host defence the aim of our study was an extensive analysis of cell distribution and function of CD4+ and CD8+ T lymphocytes and NK cells. We found that naive (CD45RA+) CD4+ lymphocytes, as well as CD8+/CD45RA+ lymphocytes, are decreased, whereas NK cells (CD3-/CD16+CD56+) are significantly elevated in AT patients. In our culture system proliferation and cytokine production was normal in purified memory (CD45RO+) lymphocytes after stimulation with phorbol-12,13-dibutyrate (PBu2) and after PHA activation, indicating that differences in proliferation and cytokine production are due solely to reduced numbers of CD45RA+ lymphocytes. However, activation, and especially intracellular interferon production of AT lymphocytes, seem to follow different kinetics compared to controls. In contrast to polyclonal activation, stimulation via the T cell receptor results consistently in a reduced immune response. Taken together, our results suggest that deficiency of immunocompetent cells and an intrinsic immune activation defect are responsible for the immunodeficiency in AT.


Figures
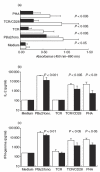
Fig. 1
Fig. 1
Function of peripheral blood mononuclear cells (PBMC) and CD45RO+lymphocytes. Figure shows stimulation of PBMC (a–c) and separated CD45RO+ lymphocytes (d–f) derived from AT patients (filled bars, n = 8) and controls (open bars, n = 10). Cells were stimulated with phorbol-12,13-dibutyrate (PBu2) and ionomycin, PHA and via the T cell receptor with and without CD28 co-stimulation. Proliferation (a + d), IL-2 production (b + e) and IFN-γ production (d + f) were detected by BrdU incorporation or by ELISA, respectively. To investigate whether IFN-γ production could be enhanced, cells were stimulated additionally with IL-2 (g). Results are shown as mean ± s.d. P-values based on Student's t-test.
Fig. 1
Fig. 1
Function of peripheral blood mononuclear cells (PBMC) and CD45RO+lymphocytes. Figure shows stimulation of PBMC (a–c) and separated CD45RO+ lymphocytes (d–f) derived from AT patients (filled bars, n = 8) and controls (open bars, n = 10). Cells were stimulated with phorbol-12,13-dibutyrate (PBu2) and ionomycin, PHA and via the T cell receptor with and without CD28 co-stimulation. Proliferation (a + d), IL-2 production (b + e) and IFN-γ production (d + f) were detected by BrdU incorporation or by ELISA, respectively. To investigate whether IFN-γ production could be enhanced, cells were stimulated additionally with IL-2 (g). Results are shown as mean ± s.d. P-values based on Student's t-test.
Fig. 2
Fig. 2
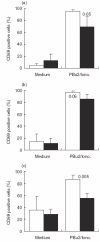
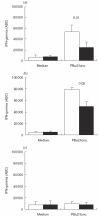
Proportion of activated lymphocytes (CD69+) in CD3+/CD4+ T cells (a), CD3+/CD8+ T cells (b) and NK cells (c) and analysis of intracellular IFN-γ expression in CD3+/CD4+ T cells (d), CD3+/CD8+ T cells (e) and NK cells (f). Lymphocytes from AT patients (filled bars, n = 5) and controls (open bars, n = 8) were stimulated with phorbol-12,13-dibutyrate (PBu2) and ionomycin for 5 h. Cytokine secretion was inhibited by monensin. Results are shown as mean ± s.d. P-values based on Student's t-test.
Fig. 2
Fig. 2
Proportion of activated lymphocytes (CD69+) in CD3+/CD4+ T cells (a), CD3+/CD8+ T cells (b) and NK cells (c) and analysis of intracellular IFN-γ expression in CD3+/CD4+ T cells (d), CD3+/CD8+ T cells (e) and NK cells (f). Lymphocytes from AT patients (filled bars, n = 5) and controls (open bars, n = 8) were stimulated with phorbol-12,13-dibutyrate (PBu2) and ionomycin for 5 h. Cytokine secretion was inhibited by monensin. Results are shown as mean ± s.d. P-values based on Student's t-test.
Fig. 3
Fig. 3
Intracellular IFN-γ quantification. Intracellular IFN-γ level of PBMC derived from AT patients (filled bars, n = 5) and controls (open bars, n = 8) were investigated by intracellular flow cytometry. Amount of IFN-γ was quantified by antigen binding capacity (ABC). Therefore, mean fluorescence of microbeads labelled with different levels of IFN-γ FITC MoAb were detected and calibration plot and intracellular IFN-γ levels (a–c) were calculated using the QuickCal® research software. Lymphocytes were differentiated in CD3+/CD4+ cells (a), CD3+/CD8+ cells (b) and CD3/CD16+CD56+ cells (c). Cells were stimulated with phorbol-12,13-dibutyrate (PBu2) and ionomycin for 5h and cytokine secretion was inhibited by monensin. Results are shown as mean ± s.d. P-value based on Student's t-test.

References

    1. Gatti RA, Boder E, Vinters HV, Sparkes RS, Norman A, Lange K. Ataxia-telangiectasia: an interdisciplinary approach to pathogenesis. Medicine. 1991;70:99–117. - PubMed
    1. Lavin F, Shiloh Y. The genetic defect in ataxia-telangiectasia. Annu Rev Immunol. 1997;15:177–202. - PubMed
    1. Savitsky K, Bar-Shira A, Gilad S, et al. A single ataxia-telangiectasia gene with a product similar to PI-3 kinase. Science. 1995;268:1749–53. - PubMed
    1. Meyn MS. Ataxia-telangiectasia and cellular responses to DNA damage. Cancer Res. 1995;55:5991–6001. - PubMed
    1. Lavin F, Shiloh Y. Ataxia-telangiectasia: a multifaceted genetic disorder associated with defective signal transduction. Curr Opin Immunol. 1996;8:459–64. - PubMed

MeSH terms