

Review
doi: 10.1046/j.1365-2125.2002.01625.x.
Measurement of renal function during drug development
Affiliations
- PMID: 12100232
- PMCID: PMC1874392
- DOI: 10.1046/j.1365-2125.2002.01625.x
Item in Clipboard
Review
Measurement of renal function during drug development
Br J Clin Pharmacol.
2002 Jul.
No abstract available
Figures
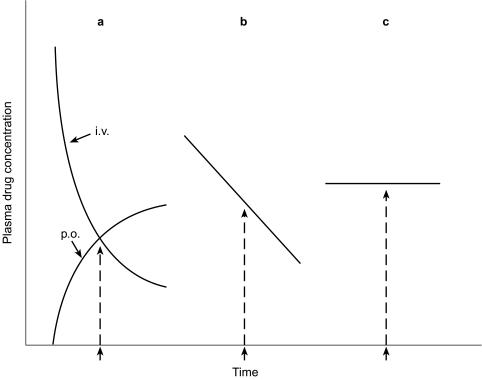
Schematic of different drug administration methods for determining the renal clearance of a marker or drug. Panel a shows plasma drug concentration-time curves after a single i.v. (descending curve) and oral (ascending curve) dose. Panel b shows a linear plasma drug disappearance curve. Panel c shows a constant plasma drug concentration at steady state during continuous i.v. infusion (from reference 16, with permission).
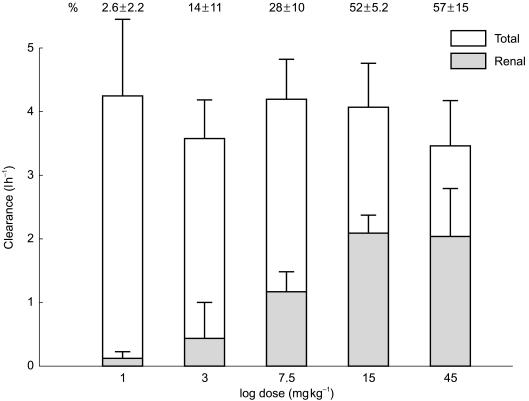
Clearance of superoxide dismutase (SOD) as a function of dose. Note that total clearance remains relatively constant while renal clearance as a percent of total clearance increases with dose. This occurs because at higher doses proximal tubular metabolism of SOD is overwhelmed allowing recovery of unchanged SOD in the urine and a more accurate assessment of the contribution of renal clearance. Estimates of renal clearance with low doses are inaccurate because the SOD cleared by the kidney never reaches the urine owing to proximal metabolism.
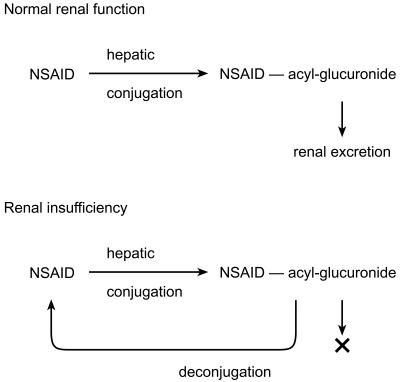
Schematic of a ‘futile cycle’ of drug metabolism where acyl-glucuronide metabolites are retained in patients with renal insufficiency. They are then able to spontaneously hydrolyse back to parent drug in the circulation resulting in its accumulation even though the parent drug per se undergoes no direct renal excretion.
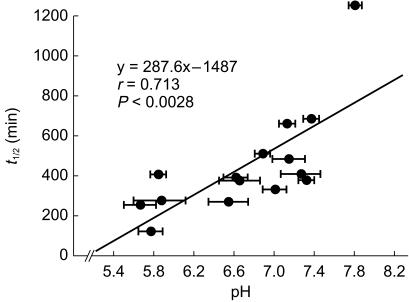
Effect of urinary pH on the elimination half-life of pseudoephedrine. Since pseudoephridine is a weak base, as urine pH becomes more alkaline, the concentration of nonionized drug in tubular fluid increases and is subject to reabsorption. This decreases renal elimination and prolongs the half-life (from reference 20 with permission).
References
-
- Zaltzman JS, Whiteside C, Cattran DC, Lopez FM, Logan AG. Accurate measurement of impaired glomerular filtration using single-dose oral cimetidine. Am J Kidney Dis. 1996;27:504–511. - PubMed
-
- Roubenoff R, Drew H, Moyer M, Petri M, Whiting-O'Keefe Q, Hellmann DB. Oral cimetidine improves the accuracy and precision of creatinine clearance in lupus nephritis. Ann Intern Med. 1990;113:501–506. - PubMed
-
- Bianchi C, Donadio C, Tramonti G. Noninvasive methods for the measurement of total renal function. Nephron. 1981;28:53–57. - PubMed
-
- Levey AS. Measurement of renal function in chronic renal disease. Kidney Int. 1990;38:167–184. - PubMed
-
- Shemesh O, Golbetz H, Kriss JP, Myers BD. Limitations of creatinine as a filtration marker in glomerulopathic patients. Kidney Int. 1985;28:830–838. - PubMed
Publication types
MeSH terms
LinkOut - more resources
Full Text Sources
Other Literature Sources
