Spo13 regulates cohesin cleavage
- PMID: 12101125
- PMCID: PMC186376
- DOI: 10.1101/gad.989302
Spo13 regulates cohesin cleavage
Abstract
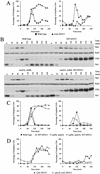
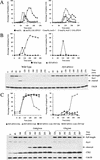
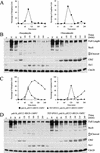
A key aspect of meiotic chromosome segregation is that cohesin, the protein complex that holds sister chromatids together, dissociates from chromosome arms during meiosis I and from centromeric regions during meiosis II. The budding yeast protein Spo13 plays a key role in preventing centromeric cohesin from being lost during meiosis I. We have determined the molecular basis for the metaphase arrest obtained when SPO13 is overexpressed during the mitotic cell cycle. Overexpression of SPO13 inhibits anaphase onset by at least two mechanisms. First, Spo13 causes a transient delay in degradation of the anaphase inhibitor Pds1. Second, Spo13 inhibits cleavage of the cohesin subunit Scc1/Mcd1 or its meiosis-specific homolog, Rec8, by the separase Esp1. The finding that Spo13 did not prevent cleavage of another Esp1 substrate, Slk19, suggests that overexpression of SPO13 is sufficient to prevent cohesin cleavage by protecting specific substrates from separase activity.
Figures


Similar articles
-
Spo13 protects meiotic cohesin at centromeres in meiosis I.Genes Dev. 2002 Jul 1;16(13):1659-71. doi: 10.1101/gad.975802. Genes Dev. 2002. PMID: 12101124 Free PMC article.
-
Spo13 facilitates monopolin recruitment to kinetochores and regulates maintenance of centromeric cohesion during yeast meiosis.Curr Biol. 2004 Dec 29;14(24):2183-96. doi: 10.1016/j.cub.2004.12.020. Curr Biol. 2004. PMID: 15620645
-
An interplay between Shugoshin and Spo13 for centromeric cohesin protection and sister kinetochore mono-orientation during meiosis I in Saccharomyces cerevisiae.Curr Genet. 2018 Oct;64(5):1141-1152. doi: 10.1007/s00294-018-0832-x. Epub 2018 Apr 11. Curr Genet. 2018. PMID: 29644457
-
Meiotic prophase-like pathway for cleavage-independent removal of cohesin for chromosome morphogenesis.Curr Genet. 2019 Aug;65(4):817-827. doi: 10.1007/s00294-019-00959-x. Epub 2019 Mar 28. Curr Genet. 2019. PMID: 30923890 Review.
-
Cell cycle mechanisms of sister chromatid separation; roles of Cut1/separin and Cut2/securin.Genes Cells. 2000 Jan;5(1):1-8. doi: 10.1046/j.1365-2443.2000.00306.x. Genes Cells. 2000. PMID: 10651900 Review.
Cited by
-
The Iml3 protein of the budding yeast is required for the prevention of precocious sister chromatid separation in meiosis I and for sister chromatid disjunction in meiosis II.Curr Genet. 2004 Aug;46(2):82-91. doi: 10.1007/s00294-004-0516-6. Epub 2004 Jul 6. Curr Genet. 2004. PMID: 15241623
-
Mitotic expression of Spo13 alters M-phase progression and nucleolar localization of Cdc14 in budding yeast.Genetics. 2010 Jul;185(3):841-54. doi: 10.1534/genetics.109.113746. Epub 2010 Apr 20. Genetics. 2010. PMID: 20407133 Free PMC article.
-
Rephrasing anaphase: separase FEARs shugoshin.Chromosoma. 2005 Mar;113(8):409-17. doi: 10.1007/s00412-005-0331-y. Epub 2005 Feb 10. Chromosoma. 2005. PMID: 15703941 Review.
-
Rewiring of the phosphoproteome executes two meiotic divisions in budding yeast.EMBO J. 2024 Apr;43(7):1351-1383. doi: 10.1038/s44318-024-00059-8. Epub 2024 Feb 27. EMBO J. 2024. PMID: 38413836 Free PMC article.
-
Tell the Difference Between Mitosis and Meiosis: Interplay Between Chromosomes, Cytoskeleton, and Cell Cycle Regulation.Front Cell Dev Biol. 2021 Apr 8;9:660322. doi: 10.3389/fcell.2021.660322. eCollection 2021. Front Cell Dev Biol. 2021. PMID: 33898463 Free PMC article. Review.
References
-
- Alexandru G, Uhlmann F, Mechtler K, Poupart MA, Nasmyth K. Phosphorylation of the cohesin subunit Scc1 by Polo/Cdc5 kinase regulates sister chromatid separation in yeast. Cell. 2001;105:459–472. - PubMed
-
- Buonomo SB, Clyne RK, Fuchs J, Loidl J, Uhlmann F, Nasmyth K. Disjunction of homologous chromosomes in meiosis I depends on proteolytic cleavage of the meiotic cohesin Rec8 by separin. Cell. 2000;103:387–398. - PubMed
-
- Cohen-Fix O. The making and breaking of sister chromatid cohesion. Cell. 2001;106:137–140. - PubMed
-
- Cohen-Fix O, Peters J-M, Kirschner MW, Koshland D. Anaphase initiation in Saccharomyces cerevisiae is controlled by the APC-dependent degradation of the anaphase inhibitor Pds1p. Genes & Dev. 1996;10:3081–3093. - PubMed
-
- Gardner RD, Burke DJ. The spindle checkpoint: Two transitions, two pathways. Trends Cell Biol. 2000;10:154–158. - PubMed
Publication types
MeSH terms
Substances
Grants and funding
LinkOut - more resources
Full Text Sources
Molecular Biology Databases
