. 2002 Jun;89 Spec No(7):841-50.
doi: 10.1093/aob/mcf096.

Drought and oxidative load in the leaves of C3 plants: a predominant role for photorespiration?

Affiliations

Drought and oxidative load in the leaves of C3 plants: a predominant role for photorespiration?

Graham Noctor et al. Ann Bot. 2002 Jun.

Abstract

Although active oxygen species are produced at high rates in both the chloroplasts and peroxisomes of the leaves of C3 plants, most attention has focused on the potentially damaging consequences of enhanced chloroplastic production in stress conditions such as drought. This article attempts to provide quantitative estimates of the relative contributions of the chloroplast electron transport chain and the glycolate oxidase reaction to the oxidative load placed on the photosynthetic leaf cell. Rates of photorespiratory H2O2 production were obtained from photosynthetic and photorespiratory flux rates, derived from steady-state leaf gas exchange measurements at varying irradiance and ambient CO2. Assuming a 10% allocation of photosynthetic electron flow to the Mehler reaction, photorespiratory H2O2 production would account for about 70% of total H2O2 formed at all irradiances measured. When chloroplastic CO2 concentration rates are decreased, photorespiration becomes even more predominant in H2O2 generation. At the increased flux through photorespiration observed at lower ambient CO2, the Mehler reaction would have to account for more than 35% of the total photosynthetic electron flow in order to match the rate of peroxisomal H2O2 production. The potential signalling role of H2O2 produced in the peroxisomes is emphasized, and it is demonstrated that photorespiratory H2O2 can perturb the redox states of leaf antioxidant pools. We discuss the interactions between oxidants, antioxidants and redox changes leading to modified gene expression, particularly in relation to drought, and call attention to the potential significance of photorespiratory H2O2 in signalling and acclimation.


Figures

None
Fig. 1. Rate of net photosynthesis and derived parameters plotted against irradiance (A, C, E) and ambient CO2 concentration (B, D, F) for attached leaves of wheat (circles) and potato (triangles). A and B, Net CO2 uptake; C and D, rate of RuBP oxygenation (vo); E and F, rate of total RuBP utilization (vRuBP). Wheat (Triticum aestivum ‘Cannon’) and potato (Solanum tuberosum ‘désirée’) were grown in soil and slow‐release fertilizer to the age of 4–5 weeks (wheat) or 6–9 weeks (potato) in controlled‐environment glasshouses (day length 14 h, day/night temperature 22/18 °C, irradiance 250 µmol quanta m–2 s–1). Plants were transferred to the laboratory for measurements of steady‐state photosynthesis. CO2 and H2O exchange were measured in a multi‐chamber system designed and developed at Rothamsted by Lawlor and colleagues (Paul et al., 1990). The measuring systems consisted of four or six temperature‐ and humidity‐controlled chambers, illuminated from above by floodlamps and connected to a gas‐mixer and infra‐red gas analyser (IRGA). All experiments were conducted at 20 °C, 50 % relative humidity and 21 % O2. CO2 composition was controlled by a gas mixer and irradiance by neutral density sheets. For wheat, middle sections of the fourth leaf were used; for potato, the half of a fully expanded leaf distal from the petiole was introduced into the chamber. For irradiance curves, CO2 was 360 µl l–1; for CO2 curves, irradiance was 650–750 µmol m–2 s–1 at the leaf surface. Leaves were incubated for 30 min in darkness, before illumination at each condition until a steady‐state rate of photosynthesis was reached (30–40 min). To calculate vo and vRuBP, the Rubisco specificity factor (Srel) was taken to be 110 (Keys, 2000) and the chloroplastic oxygen concentration (Oc) was assumed to be that of water in equilibrium with air at 20 °C (276 µm). The chloroplastic CO2 concentration (Cc) was derived from Ci by taking a CO2 transfer conductance through the mesophyll (gi) of 0·3 mol m–2 s–1 (von Caemmerer et al., 1994) and assuming that the rate of CO2 uptake affects Cc relative to Ci as in Ruuska et al. (2000): Cc = CiA/gi. Cc was converted to a molar concentration by applying a CO2 solubility constant at 20 °C of 0·0392 mol l–1 (von Caemmerer, 2000). The ratio of oxygenation to carboxylation was calculated as O : C = (1/Srel)(Oc/Cc) and vo was derived according to Sharkey (1988): vo = (A – R)/(1/O : C – 0·5), where R is non‐photorespiratory CO2 release in the light (negative value). The ‘real’ or gross rate of carboxylation at Rubisco was derived as vc = A + 0·5 vo – R, and the total rate of RuBP utilization as vRuBP = vo + vc.
None
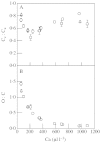
Fig. 2. Modelled data derived from measurements of net CO2 uptake and intercellular CO2 concentration (Ci) in attached wheat leaves at different CO2 concentrations. Ca and Cc, ambient and chloroplastic CO2 concentration, respectively; O : C, ratio of RuBP oxygenation to RuBP carboxylation. Data are shown from three independent experiments (methods as in legend to Fig. 1). For each experiment, values are means ± s.e. of three (circles) or four (triangles, squares) leaves. Circles, Experiment in which four leaves, each attached to a different plant, were measured in the steady‐state (30–40 min illumination at the Ca values indicated). Triangles and squares, Experiments in which each measurement at each Ca value was carried out with different leaves, each attached to a different plant. Irradiance was 675–838 µmol m–2 s–1, temperature was 20 °C and gas composition was 21 % O2, CO2 concentration (Ca) as indicated and balance N2.
None
Fig. 3. Relationship between net CO2 uptake (A and B), the derived rate of electron flow associated with carboxylation and oxygenation (C and D), and the relative rate of linear electron transport, calculated from chlorophyll fluorescence quenching. A and C, Attached leaves of wheat; B and D, attached leaves of potato. Chlorophyll fluorescence was measured simultaneously with gas exchange using an oxy‐blot fluorometer. The fluorescence excitation beam and emission signal, as well as saturating light flashes, were passed down a fibre‐optic held in fixed position for each chamber by mountings built at Rothamsted. The optic was held at 45° to the leaf surface and monitored that part of the leaf which corresponded to the central third of the leaf portion in the chamber. All leaves used gave Fv/Fm > 0·8 after 30 min dark incubation. Photosynthesis was then induced by illumination under conditions of varying light (circles), CO2 (triangles) or O2 (squares). On attainment of the steady‐state rate of net CO2 uptake (30–40 min illumination), the fluorescence of leaves in each chamber was monitored sequentially for 3 min, during which time Fm′ was measured by applying two saturating flashes (4000 µmol quanta m–2 s–1, 2 s duration, 2 min between flashes). The photochemical yield of PSII (ΦPSII) was calculated according to Genty et al. (1989) and Je was calculated as 4 (vo + vc), assuming that each carboxylation event gives rise to 2 PGA and that each oxygenation event produces 1·5 PGA + 0·5 NH3, whose reassimilation in the chloroplast involves ferredoxin‐dependent glutamate synthase (2 e per NH3). All points represent the means of two or four different plants (standard errors are shown where values are means of four). For wheat, black circles show data at ‘control’ conditions (irradiance = 750 µmol m–2 s–1, CO2 = 382 µl l–1, O2 = 21 %). White and grey circles, Gas composition as for ‘controls’ but irradiance = 112 and 340 µmol m–2 s–1, respectively. Triangles show data at the same light and O2 tension except CO2 = 123 (white), 232 (grey) and 1055 (black) µl l–1. Squares show data at control light and CO2 but O2 = 2 % (white) and 7 % (grey). For potato, ‘control’ conditions were as for wheat and are denoted by grey squares. White and black circles, Control gas composition but irradiance = 235 and 1250 µmol m–2 s–1, respectively. Triangles show data at control light and O2 but CO2 = 60 (white), 96 (grey with cross), 150 (grey) and 220 (black) µl l–1. Squares, Conditions as for squares in wheat data.
None
Fig. 4. Effect of irradiance on modelled rates of H2O2 production in photorespiration and following superoxide production at PSI. Triangles, H2O2 production in the Mehler reaction; cicles, H2O2 production in photorespiration; squares, total H2O2 production. Steady‐state photo synthesis was measured in attached leaves of wheat at Ca = 350 µl l–1, 212 and irradiance as indicated. Photorespiratory H2O2 production is equal to vo, derived as in Fig. 1. H2O2 production in the chloroplast assumes that 10 % of total electron flow through the photosynthetic electron transport chain is linked to the Mehler–peroxidase reaction. Calculation of total electron flow assumes no sinks other than the Mehler–peroxidase reaction, photorespiration and CO2 fixation. The utilization of electrons associated with photorespiration and CO2 fixation was calculated as described for Fig. 3. If the Mehler reaction accounts for 10 % of photosynthetic electrons, then total electron flow, JII, is 40/9 (vo + vc), and steady‐state H2O2 production in the chloroplast = 0·025 JII (O2 + 2e + 2H+ = H2O2, plus two electrons required in the peroxidatic conversion of H2O2 to H2O = four electrons per H2O2 generated).
None
Fig. 5. Changes in H2O2 production with ambient CO2 concentration in attached wheat leaves. The production in photorespiration (A), O2 reduction in the chloroplast (B) and the total amount generated (C) were calculated as described for Fig. 4. Different symbols show three independent experiments. Circles show values that are the means ± s.e. of three different plants, the same set of plants being measured at each CO2 concentration. Squares and triangles show means ± s.e. of four different plants, with a different set of plants being measured at each CO2 concentration.
None
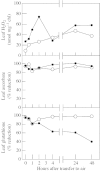
Fig. 6. Changes in leaf H2O2 and the redox states of the principal soluble leaf antioxidants, ascorbate and glutathione, in wild‐type barley (open circles) and a mutant deficient in catalase (closed circles). Barley (Hordeum vulgare, var. Maris Mink) and the catalase‐deficient mutant (RPr 79/4; Kendall et al., 1983) were grown under the same conditions as wheat (Fig. 1), except that ambient CO2 was artificially maintained at 0·6 %. Suppression of photorespiration is necessary for healthy growth of the mutant (Kendall et al., 1983). Six weeks after seeds were sown, plants were transferred to a chamber in which conditions were identical to that in which they had been grown, except that the ambient CO2 concentration was 400 µl l–1. Leaf samples were taken at the indicated times after transfer, for determination of H2O2, glutathione and ascorbic acid. H2O2 was extracted and determined by a modified peroxidase‐coupled assay (Veljovic‐Jovanovic et al., 2002). Reduced and total ascorbate, and total and oxidized glutathione, were assayed as described in Foyer et al. (1995).

Similar articles

Cited by

References

    1. AlvarezME, Pennell RI, Meijer P‐J, Ishikawa Am, Dixon RA, Lamb C.1998. Reactive oxygen intermediates mediate a systemic signal network in the establishment of plant immunity. Cell 92: 773–784. - PubMed
    1. ArisiACM, Cornic G, Jouanin L, Foyer CH.1998. Overexpression of iron superoxide dismutase in transformed poplar modifies the regulation of photosynthesis at low CO2 partial pressures or following exposure to the prooxidant herbicide methyl viologen. Plant Physiology 117: 565–574. - PMC - PubMed
    1. BartoliCG, Simontacchi M, Tambussi E, Beltrano J, Montaldi E, Puntarulo S.1999. Drought and watering‐dependent oxidative stress: effect on antioxidant content in Triticum aestivum L. leaves. Journal of Experimental Botany 50: 375–383.
    1. BiehlerK, Fock H.1996. Evidence for the contribution of the Mehler‐peroxidase reaction in dissipating excess electrons in drought‐stressed wheat. Plant Physiology 112: 265–272. - PMC - PubMed
    1. CornicG, Briantais J‐M.1991. Partitioning of photosynthetic electron flow between CO2 and O2 reduction in a C3 leaf (Phaseolus vulgaris L.) at different CO2 concentrations and during drought stress. Planta 183: 178–184. - PubMed

Publication types

MeSH terms