Review
. 2002 Jun;89 Spec No(7):887-94.
doi: 10.1093/aob/mcf064.

Photosynthetic carbon reduction and carbon oxidation cycles are the main electron sinks for photosystem II activity during a mild drought

Affiliations
Review

Photosynthetic carbon reduction and carbon oxidation cycles are the main electron sinks for photosystem II activity during a mild drought

Gabriel Cornic et al. Ann Bot. 2002 Jun.

Abstract

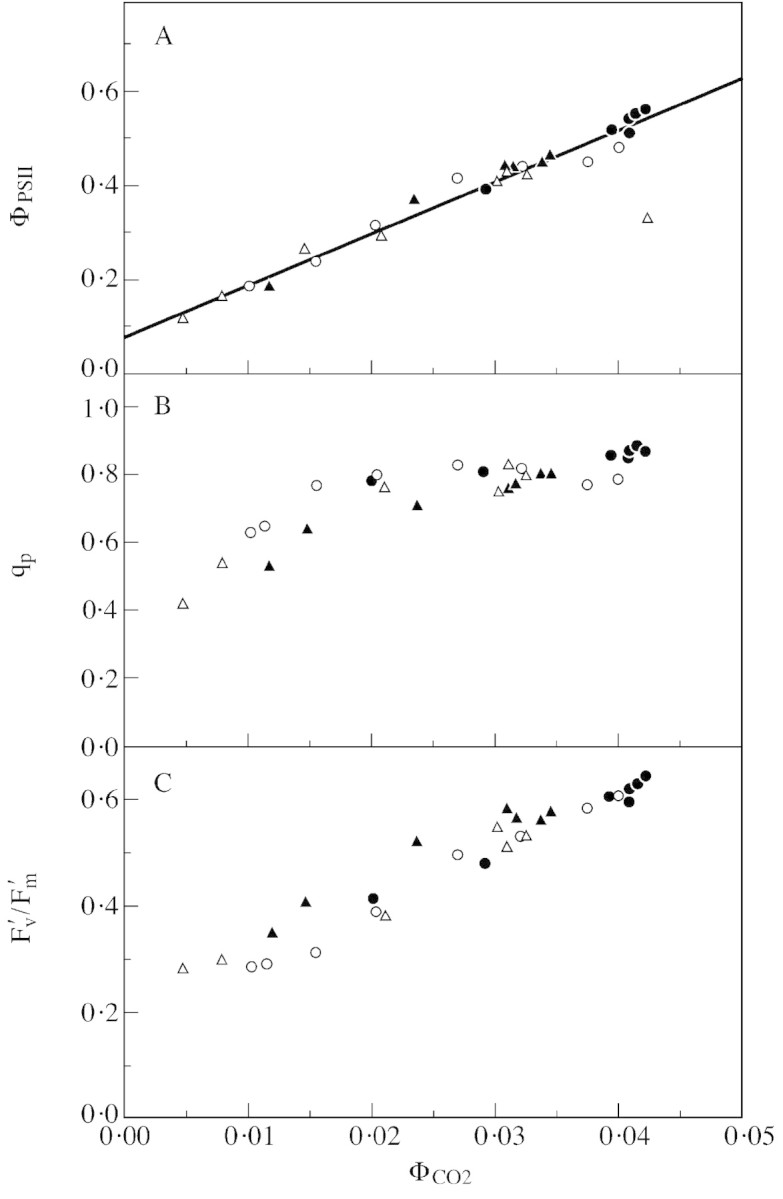
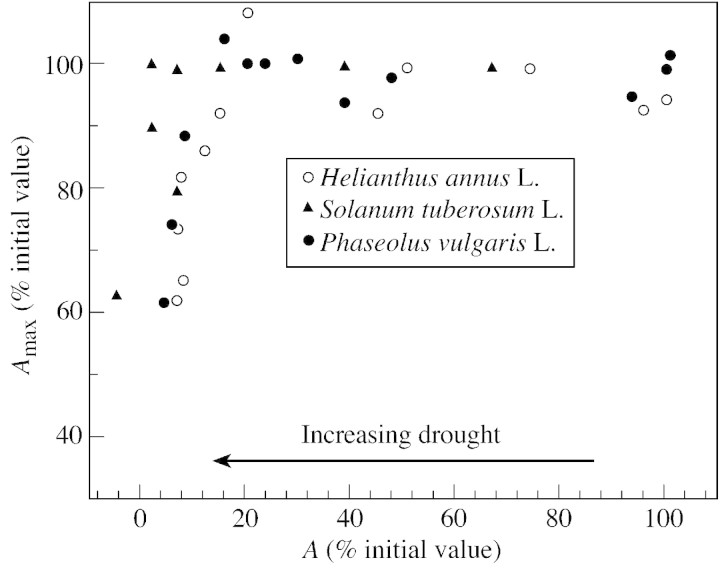
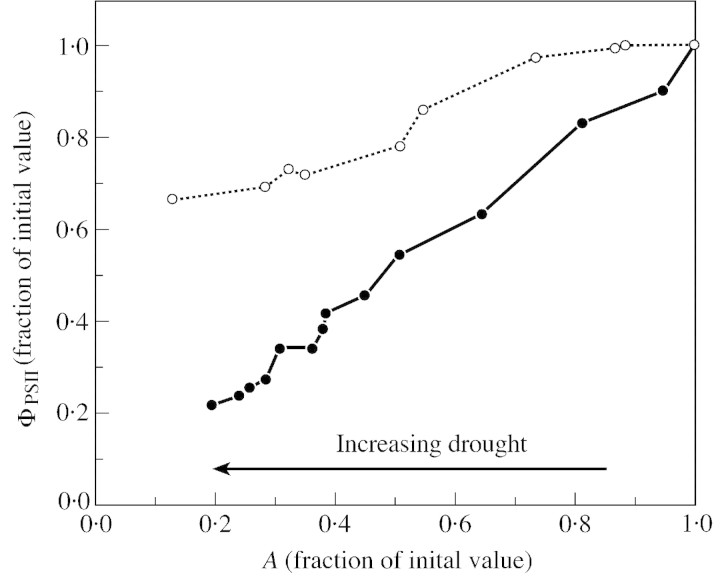
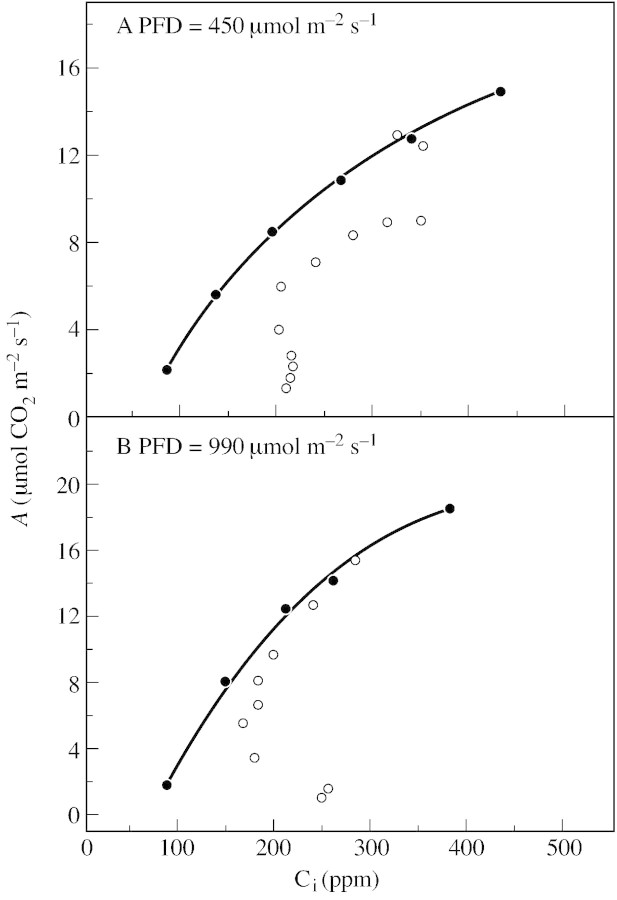
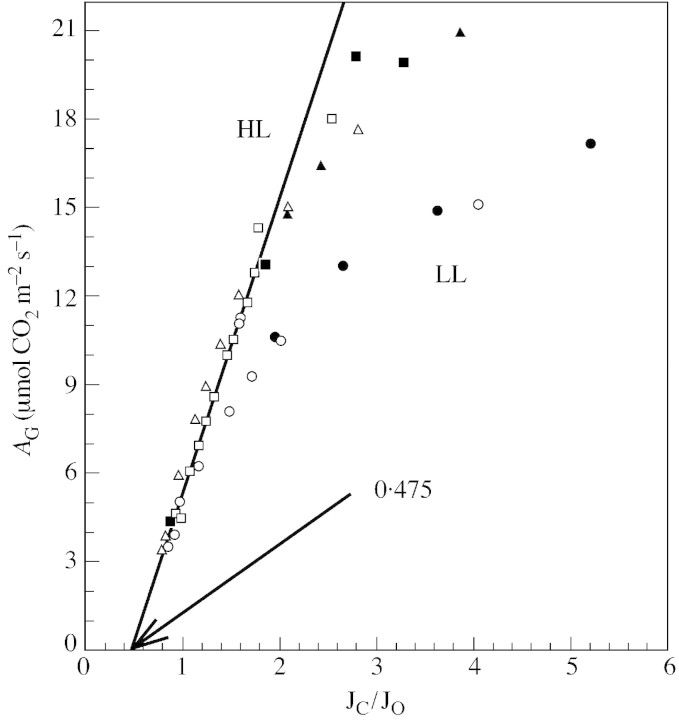
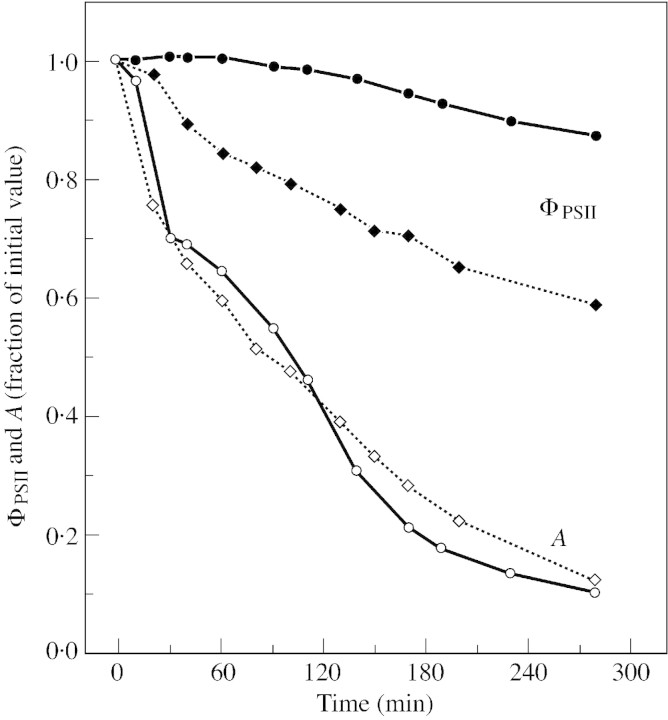
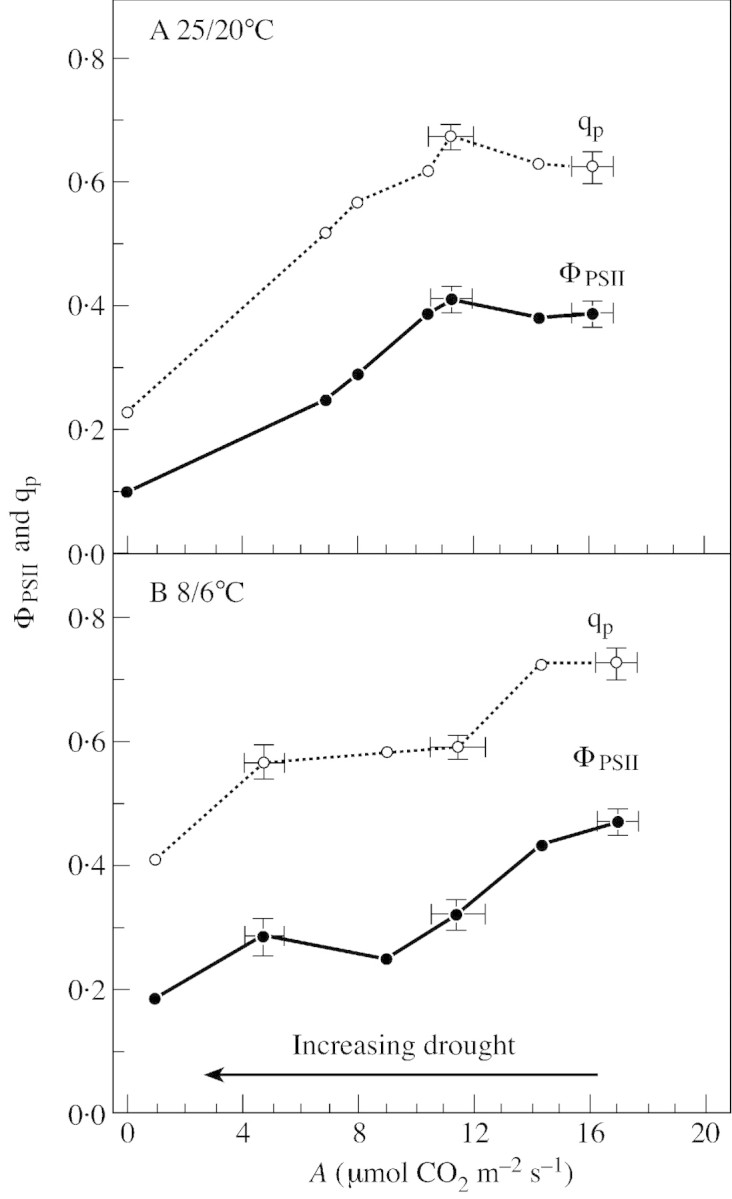
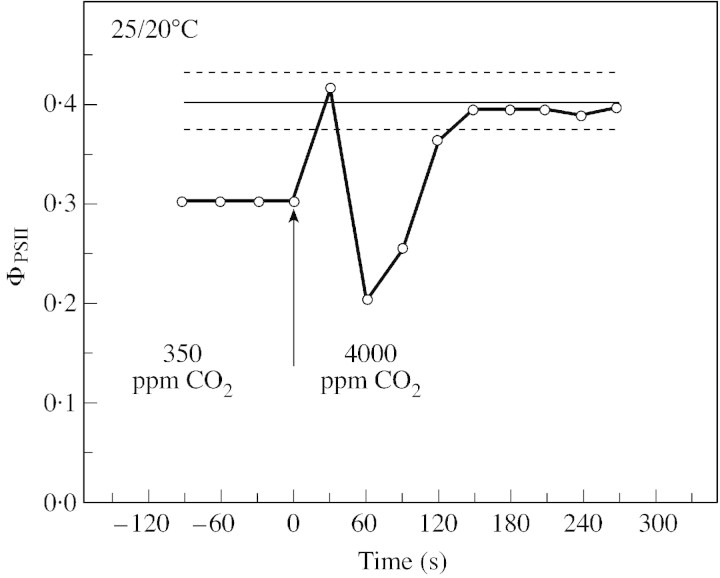
Stomatal closure can explain the inhibition of net CO2 uptake by a leaf subjected to a mild drought: the photosynthetic apparatus appears resistant to lack of water. Changes in both the water content of leaves maintained in a constant environment and the ambient CO2 molar fraction during measurements on well-hydrated leaves lead to similar effects on net CO2 uptake and whole chain electron transport as estimated by leaf chlorophyll fluorescence measurements. In particular, it is shown that photosystem II (PSII) functioning and its regulation are not qualitatively changed during desiccation and that the variations in PSII photochemistry can simply be understood by changes in substrate availability in this condition. Moreover, an analysis of the literature shows that when inhibition of net CO2 uptake by C3 leaves under drought (Phaseolus vulgaris L., Helianthus annus L. and Solanum tuberosum L.) was lower than 80 %, elevated CO2 completely restored the photosynthetic capacity. The CO2 molar fraction in the chloroplasts declines as stomata close in drying leaves. As a consequence, in C3 plants, ribulose-1,5-bisphosphate oxygenation increases and becomes the main sink for photosynthetic electrons. Depending on the prevailing photon flux density, the O2 uptake through photorespiratory activity can entirely replace carbon dioxide as an electron acceptor, or not. The rate of the Mehler reaction remains low and unchanged during desiccation. However, drought could also involve CO2-sensitive modification of the photosynthetic metabolism depending on plant growth conditions and possibly also on plant species.


Figures

None
Fig. 1. ΦPSII (A), qp (B) and Fv′/Fm′ (C) as a function of ΦCO2. Measurements were made on Zea mays L. plants either at different ambient CO2 molar ratios (Ca) on well‐hydrated leaves (closed circles) or after water was withheld, on dehydrating leaves (open circles) at normal Ca (about 360 ppm). Gas exchange chlorophyll fluorescence emission measurements were coupled as described in Cornic and Briantais (1991). Conditions during measurements were as follows: leaf temperature, 23·5 ± 0·6 °C; O2 molar ratio, 21 % in nitrogen; vapour pressure deficit (VPD), 0·7 ± 0·1 kPa; photon flux density (PFD), 450 µmol m–2 s–1 (K. Saccardy and G. Cornic, unpubl. res.).
None
Fig. 2. Relationship between Amax, the net photosynthesis (net CO2 or net O2 evolution) measured at elevated Ca (up to 10 %) and A, the net CO2 uptake by leaves maintained at normal Ca. Both Amax and A were measured during a drought. A is taken as an indicator of the water status in the leaf: it decreases as desiccation increases. Data are taken from Cornic et al. (1989, Figs 1 and 2A), Graan and Boyer (1990, Fig. 5A) and Tourneux and Peltier (1995, Figs 4C and 5).
None
Fig. 3. Relationships between relative value of ΦPSII and A during desiccation of detached leaves from P. vulgaris. The O2 molar fraction during measurements was either 21 % (closed circles) or 1 % (open circles) in nitrogen. Other conditions were as follows: leaf temperature, 23·5 °C initially, increasing to 24·9 °C at the end of the measurements; PFD, 450 µmol m–2 s–1; and Ca, about 360 ppm. Relative water content of the leaves at the end of the experiments was 76·2 and 72·8 % in 21 and 1 % O2, respectively (G. Cornic, unpubl. res.).
None
Fig. 4. Relationship between A and the leaf internal CO2 molar ratio (Ci) measured on detached Lavatera trimestris L. leaves either before (well‐hydrated, closed circles) or after (open circles) a rapid desiccation. Plants were grown in winter, in a peat soil, in a temperature‐controlled glasshouse in the University of Illinois at Urbana‐Champaign, USA (temperature from about 20 °C during the day to 17 °C during the night). Measurements were made with a LICOR 6400 under either a PFD of 450 (A) or 990 (B) µmol m–2 s–1. Other conditions were as follows: leaf temperature 25 ± 0·3 °C; Ca, 350 ppm; and VPD, 1·5 ± 0·5 kPa. Relative water content of the leaves at the end of the experiments was 70·4 and 67·7 % for A and B, respectively (G. Cornic and S. Long, unpubl. res.).
None
Fig. 5. Relation between AG (estimation of gross photosynthesis = A + dark respiration) and Jc/Jo where Jc is the rate of RuBP carboxylation and Jo the rate of RuBP oxygenation calculated as in Epron and Cornic (1993) by measuring chlorophyll fluorescence emission (with an FMS2, Hansatech fluorometer) in parallel with net CO2 uptake during the experiments presented in Fig. 4. As explained in the text, the ratio Jc/Jo is proportional to Cc, the carbon dioxide molar fraction in the chloroplasts. Measurements were performed at a PFD of 450 µmol m–2 s–1 (LL, circles) or under a PFD of 990 µmol m–2 s–1 (HL, triangles and squares), on well‐hydrated leaves (closed symbols) at different Ca, or during dehydration of the cut leaves at constant Ca (open symbols). Data were taken from Fig. 4A and B (circles and triangles). Other data from measurements taken under a PFD of 990 µmol m–2 s–1 were added (squares). Experimental conditions as in Fig. 4. The correlation line was calculated for all data corresponding to Jc/Jo < 1·4 (G. Cornic and S. Long, unpubl. res.).
None
Fig. 6. Variation in relative values of ΦPSII and A during desiccation of cut leaves of L. trimestris. Chlorophyll fluorescence emission was done in parallel with net CO2 uptake during the experiments (see Figs 4 and 5). Closed symbols, ΦPSII measurements; open symbols, A measurements. Light conditions 450 (circles) or 990 (squares) µmol m–2 s–1. These measurements were performed simultaneously with the measurements presented in Fig. 4A and B.
None
Fig. 7. Variation in ΦPSII and qp as a function of A during dehydration of Pisum sativum L. plants obtained by withholding water. Plants were grown on a peat soil in a growth cabinet and watered every 2 d. A, Plants grown at 25/20 °C (day/night), 16 h light period (normal temperature); relative water content of the leaves was about 62 % at the end of the experiment. B, Plants grown at 8–9/6 °C (day/night), 16 h light period (low temperature); relative water content of the leaves was about 69 % at the end of the experiment. In both conditions, PFD at the top of the plants during growth was 350 µmol m–2 s–1. Measurements were made as explained in Fig. 1. Conditions during measurements were: leaf temperature, 23·5 ± 0·5 °C; Ca, 360 ± 5 ppm; VPD, 0·6 ± 0.2 kPa; and PFD, 450 µmol m–2 s–1. The standard deviation of the mean is shown when it was possible to calculate the mean of three to five close measurements (N. Manuel and G. Cornic, unpubl. res.).
None
Fig. 8. Typical variation over time of ΦPSII when Ca was changed abruptly from 350 to 4000 ppm around dehydrated leaves of P. sativum plants grown at normal temperature (relative water content of the leaf = 68·2 %). Other experimental conditions were as in Fig. 7. The line parallel to the x‐axis is the mean ΦPSII value measured on well‐hydrated leaves ± s.e. (dotted lines, n = 4).
None
Fig. 9. Typical variation over time of ΦPSII when Ca was changed abruptly from 350 to 4000 ppm around dehydrated leaves of P. sativum plants grown at low temperature (relative water content of the leaf = 74·5 %). For details see Fig. 8 legend.

References

    1. ArnonDI, Chain RK.1975. Regulation of ferredoxin‐catalysed photosynthetic phosphorylation. Proceedings of the National Academy of Sciences of the USA 72: 4961–4965. - PMC - PubMed
    1. AsadaK.1999. The water to water cycle in chloroplasts: scavenging of active oxygens and dissipation of excess photons. Annual Review of Plant Physiology and Plant Molecular Biology 50: 601–639. - PubMed
    1. BadgerMR.1985. Photosynthetic oxygen‐exchange. Annual Review of Plant Physiology 36: 27–53.
    1. BadgerMR, von Caemmerer S, Ruuska S, Nakano H.2000. Electron flow to oxygen in higher plants and algae: rates and control of direct photoreduction (Mehler reaction) and rubisco oxygenase. Philosophical Transactions of the Royal Society of London B 355: 1433–1446. - PMC - PubMed
    1. BernacchiCL, Singsaas EL, Pimentel C, Portis Jr AR, Long SP.2001. Improved temperature response functions for models of Rubisco‐limited photosynthesis. Plant Cell and Environment 24: 253–259.

MeSH terms