

A novel target gene, SKP2, within the 5p13 amplicon that is frequently detected in small cell lung cancers
- PMID: 12107105
- PMCID: PMC1850681
- DOI: 10.1016/S0002-9440(10)64172-7
A novel target gene, SKP2, within the 5p13 amplicon that is frequently detected in small cell lung cancers
Abstract
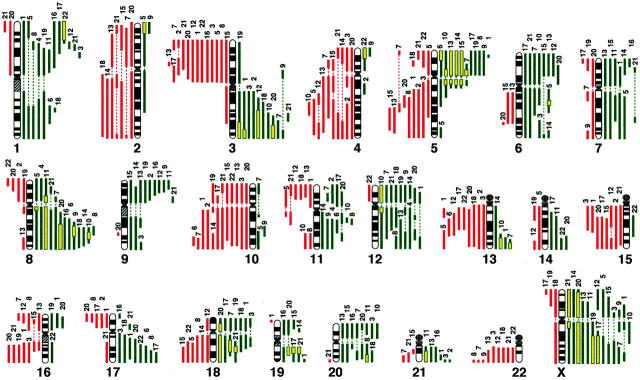
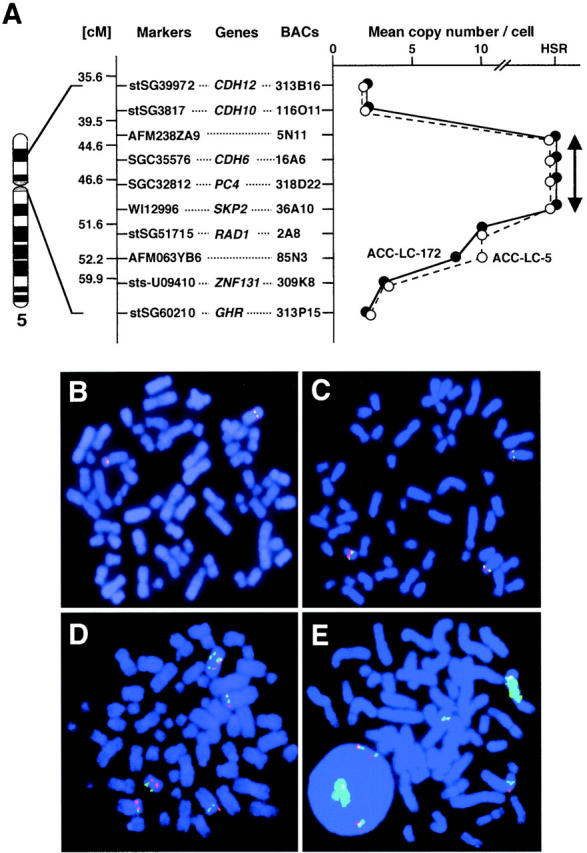
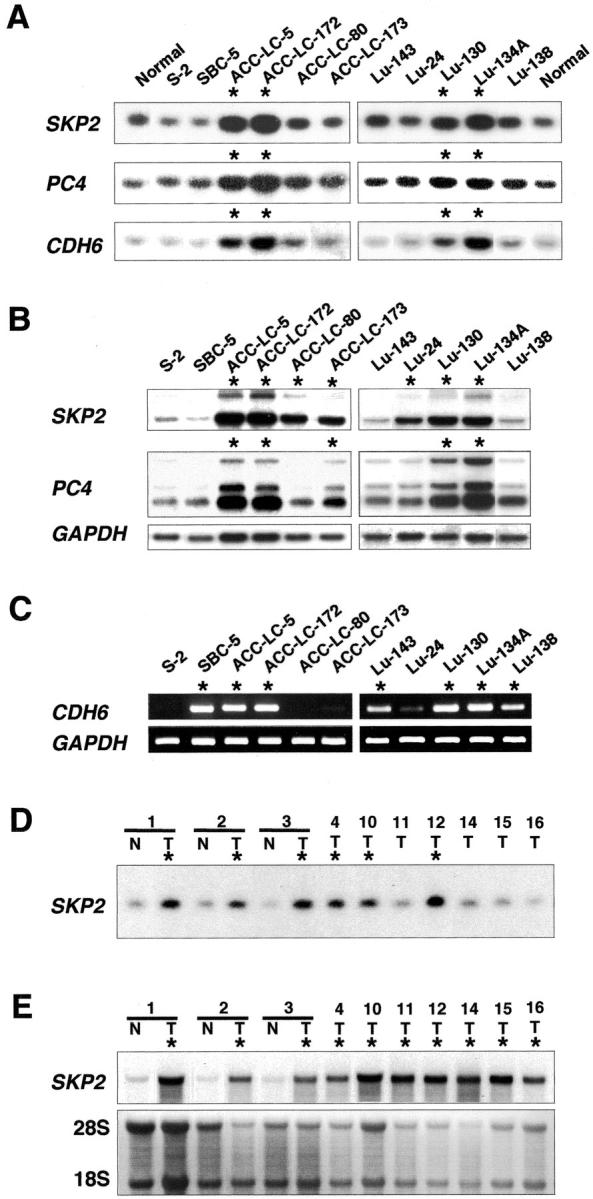
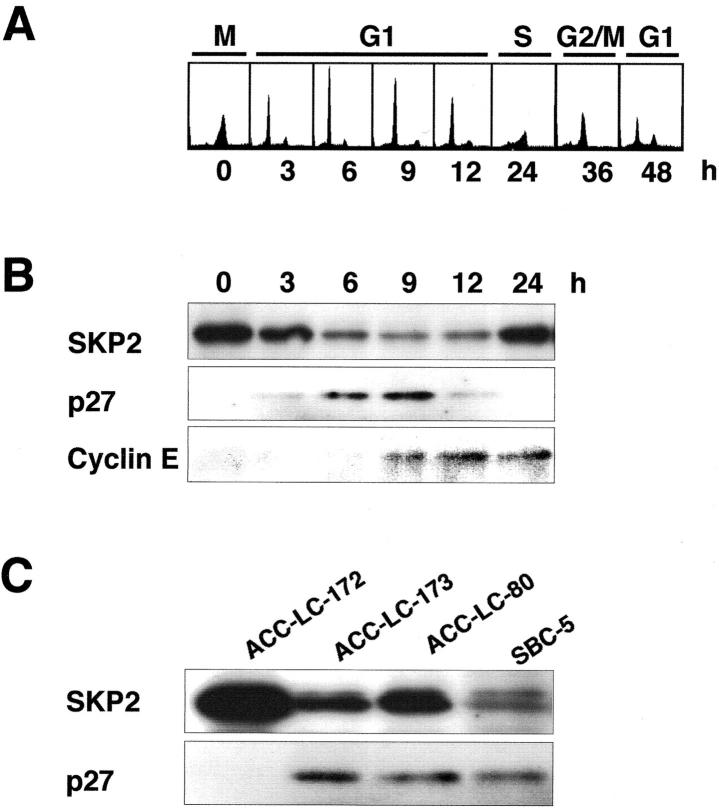
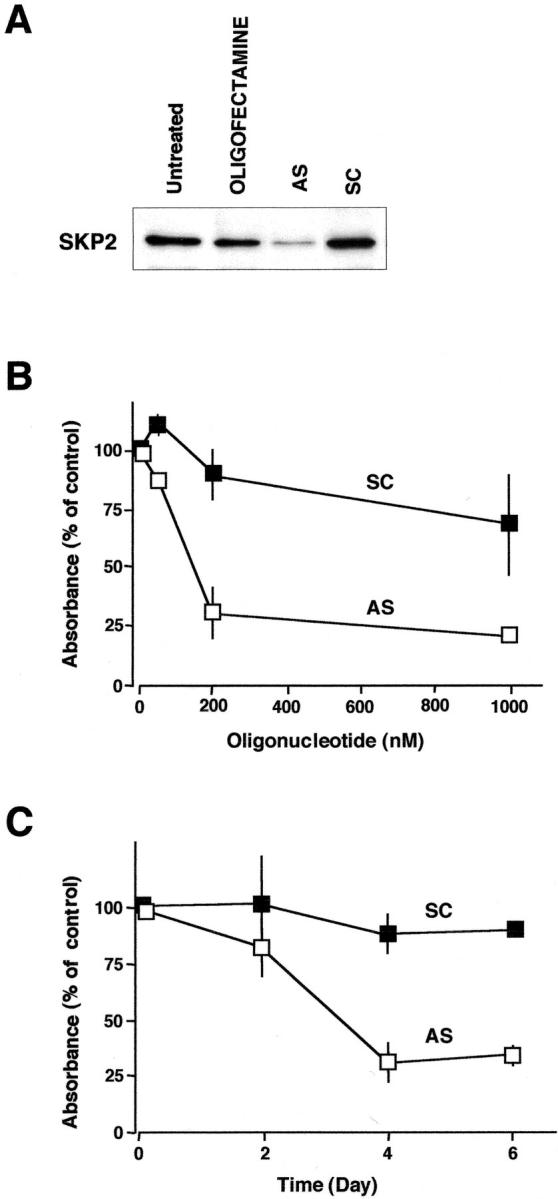
We investigated DNA copy-number aberrations in 22 cell lines derived from small cell lung cancers (SCLCs) using comparative genomic hybridization. A minimal common region at 5p13, within the 5p11-p13 amplicon that was most frequently involved, harbored the CDH6, PC4, and SKP2 genes. These three genes showed amplification and consequent overexpression in the SCLC cell lines. SKP2 positively regulates progression of cell cycle by targeting several regulators, such as the cell-cycle inhibitor p27(KIP1), for ubiquitin-mediated degradation. SKP2 was amplified in 7 (44%) of 16 primary SCLC tumors, and consequently overexpressed in 10 (83%) of the 12 of those tumors we examined. Expression levels of SKP2 protein were cell cycle-dependent in SCLC cells as well as in normal cells, and were correlated with the DNA copy-number of the gene. There was an inverse correlation between the expression of SKP2 and p27(KIP1) proteins. Down-regulation of SKP2 using an anti-sense oligonucleotide remarkably suppressed the growth of SCLC cells. Our results indicate that SKP2 is likely to be a target of the 5p13 amplification and to play an important role in the growth of SCLC cells.
Figures
Similar articles
-
Amplification and overexpression of SKP2 are associated with metastasis of non-small-cell lung cancers to lymph nodes.Am J Pathol. 2004 Jul;165(1):175-80. doi: 10.1016/S0002-9440(10)63286-5. Am J Pathol. 2004. PMID: 15215173 Free PMC article.
-
Down-regulation of SKP2 induces apoptosis in lung-cancer cells.Cancer Sci. 2003 Apr;94(4):344-9. doi: 10.1111/j.1349-7006.2003.tb01444.x. Cancer Sci. 2003. PMID: 12824902 Free PMC article.
-
Regulation of p27 by S-phase kinase-associated protein 2 is associated with aggressiveness in non-small-cell lung cancer.J Clin Oncol. 2004 Oct 15;22(20):4165-73. doi: 10.1200/JCO.2004.01.035. J Clin Oncol. 2004. PMID: 15483027
-
Oncogenic properties and prognostic implications of the ubiquitin ligase Skp2 in cancer.Cancer. 2008 Apr 1;112(7):1415-24. doi: 10.1002/cncr.23317. Cancer. 2008. PMID: 18260093 Review.
-
Molecular genetics of small cell lung carcinoma.Semin Oncol. 2001 Apr;28(2 Suppl 4):3-13. Semin Oncol. 2001. PMID: 11479891 Review.
Cited by
-
Skp2 expression is associated with down-regulation of p27 protein and cell proliferation in salivary adenoid cystic carcinoma.Virchows Arch. 2007 May;450(5):567-74. doi: 10.1007/s00428-007-0391-x. Epub 2007 Mar 13. Virchows Arch. 2007. PMID: 17431674
-
Ubiquitin-mediated control of oncogene and tumor suppressor gene products.Cancer Sci. 2009 Aug;100(8):1374-81. doi: 10.1111/j.1349-7006.2009.01196.x. Epub 2009 May 19. Cancer Sci. 2009. PMID: 19459846 Free PMC article. Review.
-
Role of E3 ubiquitin ligases in lung cancer.World J Clin Oncol. 2013 Aug 10;4(3):58-69. doi: 10.5306/wjco.v4.i3.58. World J Clin Oncol. 2013. PMID: 23936758 Free PMC article.
-
SKP2 Activation by Thyroid Hormone Receptor β2 Bypasses Rb-Dependent Proliferation in Rb-Deficient Cells.Cancer Res. 2017 Dec 15;77(24):6838-6850. doi: 10.1158/0008-5472.CAN-16-3299. Epub 2017 Sep 28. Cancer Res. 2017. PMID: 28972075 Free PMC article.
-
Apigenin induces apoptosis via downregulation of S-phase kinase-associated protein 2-mediated induction of p27Kip1 in primary effusion lymphoma cells.Cell Prolif. 2010 Apr;43(2):170-83. doi: 10.1111/j.1365-2184.2009.00662.x. Epub 2010 Jan 14. Cell Prolif. 2010. PMID: 20074295 Free PMC article.
References
-
- Shimosato Y, Nakajima T, Hirohashi S, Morinaga S, Terasaki T, Yamaguchi K, Saijo N, Suemasu K: Biological, pathological and clinical features of small cell lung cancer. Cancer Lett 1986, 33:241-258 - PubMed
-
- Vincent RG, Pickren JW, Lane WW, Bross I, Takita H, Houten L, Gutierrez AC, Rzepk T: The changing histopathology of lung cancer: a review of 1682 cases. Cancer 1977, 39:1647-1655 - PubMed
-
- Landis SH, Murray T, Bolden S, Wingo PA: Cancer statistics, 1999. CA Cancer J Clin 1999, 49:8-31 - PubMed
-
- Yoshimura K, Yamashita N: Clinical statistical observation of 4,931 cases with lung cancer by histological types; results of field study in Japan. Haigan 1982, 22:1-17
-
- : The Editorial Board of the Cancer Center Statistics in Japan:: Cancer Statistics in Japan 1999 1999:12-47 Foundation for Promotion of Cancer Research, Tokyo
Publication types
MeSH terms
Substances
LinkOut - more resources
Full Text Sources
Other Literature Sources
Medical
Research Materials
Miscellaneous
