

Domain movements of plasma membrane H(+)-ATPase: 3D structures of two states by electron cryo-microscopy
- PMID: 12110571
- PMCID: PMC126128
- DOI: 10.1093/emboj/cdf385
Domain movements of plasma membrane H(+)-ATPase: 3D structures of two states by electron cryo-microscopy
Abstract
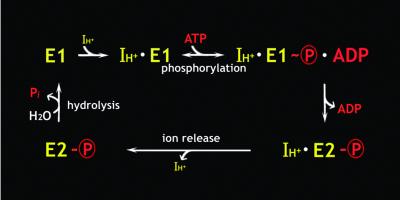
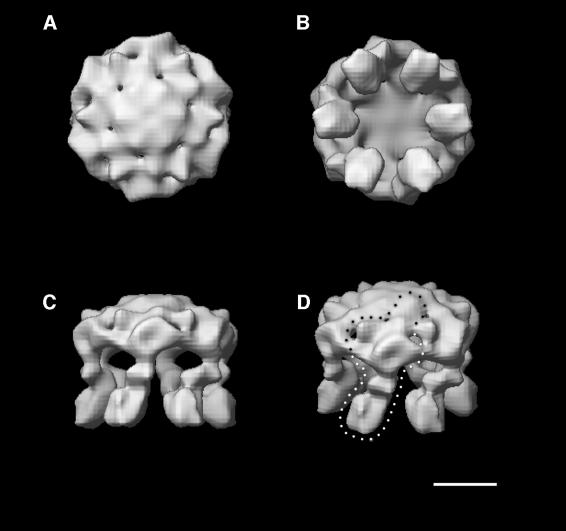
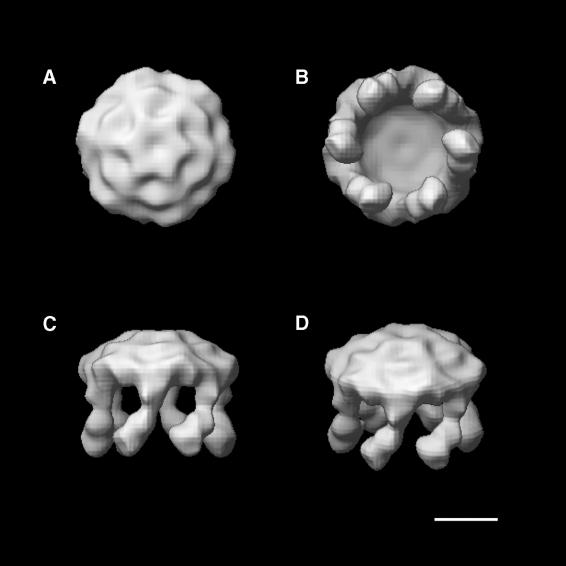
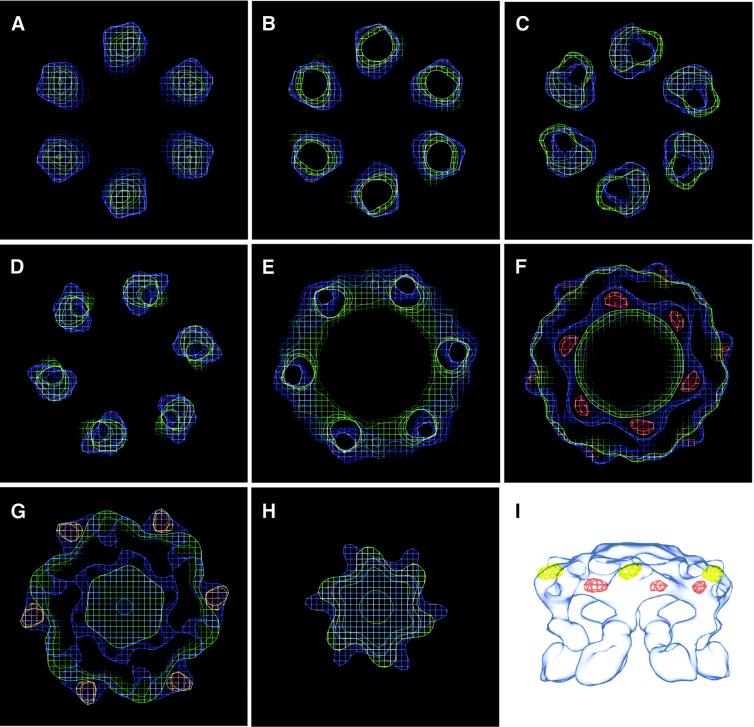
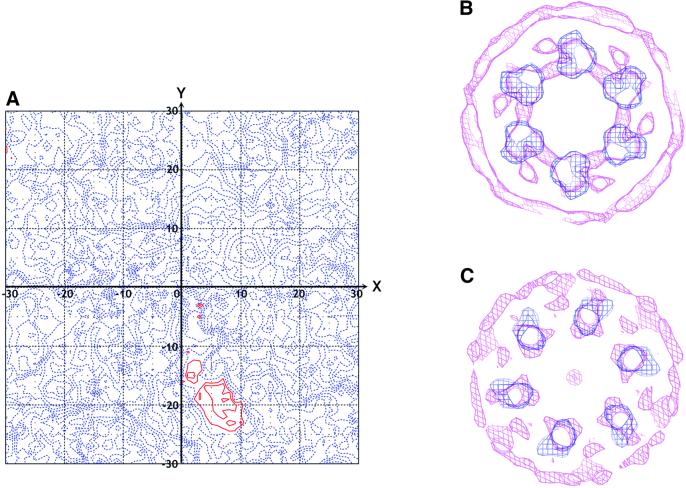
H(+)-ATPase is a P-type ATPase that transports protons across membranes using the energy from ATP hydrolysis. This hydrolysis is coupled to a conformational change between states of the protein, in which the proton-binding site is alternately accessible to the two sides of the membrane with an altered affinity. When isolated from Neurospora crassa, H(+)-ATPase is a 600 kDa hexamer of identical 100 kDa polypeptides. We have obtained the three-dimensional structures of both ligand-free and Mg(2+)/ADP-bound states of this complex using single-particle electron cryo- microscopy. Structural comparisons, together with the difference map, indicate that there is a rearrangement of the cytoplasmic domain on Mg(2+)/ADP binding, which consists of a movement of mass towards the 6-fold axis causing the structure to become more compact, accompanied by a modest conformational change in the transmembrane domain.
Figures
Similar articles
-
Three-dimensional map of the plasma membrane H+-ATPase in the open conformation.Nature. 1998 Apr 23;392(6678):840-3. doi: 10.1038/33967. Nature. 1998. PMID: 9572146
-
Probing energy coupling in the yeast plasma membrane H+-ATPase with acetyl phosphate.Arch Biochem Biophys. 1997 Aug 15;344(2):309-15. doi: 10.1006/abbi.1997.0213. Arch Biochem Biophys. 1997. PMID: 9264544
-
Structure, mechanism, and regulation of the Neurospora plasma membrane H+-ATPase.Science. 2002 Sep 6;297(5587):1692-6. doi: 10.1126/science.1072574. Epub 2002 Aug 8. Science. 2002. PMID: 12169656
-
The plasma membrane proton-translocating ATPase.Cell Mol Life Sci. 2000 Jun;57(6):871-83. doi: 10.1007/PL00000730. Cell Mol Life Sci. 2000. PMID: 10950303 Free PMC article. Review.
-
Crystallization, structure and dynamics of the proton-translocating P-type ATPase.J Exp Biol. 2000 Jan;203(Pt 1):147-54. doi: 10.1242/jeb.203.1.147. J Exp Biol. 2000. PMID: 10600683 Review.
Cited by
-
Membrane protein structures without crystals, by single particle electron cryomicroscopy.Curr Opin Struct Biol. 2015 Aug;33:103-14. doi: 10.1016/j.sbi.2015.07.009. Epub 2015 Oct 1. Curr Opin Struct Biol. 2015. PMID: 26435463 Free PMC article. Review.
-
Anionic Phospholipids Stimulate the Proton Pumping Activity of the Plant Plasma Membrane P-Type H+-ATPase.Int J Mol Sci. 2023 Aug 23;24(17):13106. doi: 10.3390/ijms241713106. Int J Mol Sci. 2023. PMID: 37685912 Free PMC article.
-
Fungal Plasma Membrane H+-ATPase: Structure, Mechanism, and Drug Discovery.J Fungi (Basel). 2024 Apr 8;10(4):273. doi: 10.3390/jof10040273. J Fungi (Basel). 2024. PMID: 38667944 Free PMC article. Review.
-
Tilt-pair analysis of images from a range of different specimens in single-particle electron cryomicroscopy.J Mol Biol. 2011 Nov 11;413(5):1028-46. doi: 10.1016/j.jmb.2011.09.008. Epub 2011 Sep 12. J Mol Biol. 2011. PMID: 21939668 Free PMC article.
-
Structure and activation mechanism of the hexameric plasma membrane H+-ATPase.Nat Commun. 2021 Nov 8;12(1):6439. doi: 10.1038/s41467-021-26782-y. Nat Commun. 2021. PMID: 34750373 Free PMC article.
References
-
- Addison R. (1986) Primary structure of the Neurospora plasma membrane H+-ATPase deduced from the gene sequence. Homology to Na+/K+-, Ca2+- and K+-ATPase. J. Biol. Chem., 261, 14896–14901. - PubMed
-
- Addison R. and Scarborough,G.A. (1982) Conformational changes of the Neurospora plasma membrane H+-ATPase during its catalytic cycle. J. Biol. Chem., 257, 10421–10426. - PubMed
-
- Auer M., Scarborough,G.A. and Kuhlbrandt,W. (1998) Three-dimensional map of the plasma membrane H+-ATPase in the open conformation. Nature, 392, 840–843. - PubMed
-
- Bastide F., Meissner,G., Fleischer,S. and Post,R.L. (1973) Similarity of the active site of phosphorylation of the adenosine triphosphatase from transport of sodium and potassium ions in kidney to that for transport of calcium ions in the sarcoplasmic reticulum of muscle. J. Biol. Chem., 248, 8385–8391. - PubMed
-
- Bellare J.R., Davis,H.T., Scriven,L.E. and Talmon,Y. (1988) Controlled environment vitrification system: an improved sample preparation technique. J. Electron Microsc. Tech., 10, 87–111. - PubMed
Publication types
MeSH terms
Substances
LinkOut - more resources
Full Text Sources
Research Materials
