. 2002 Jul 15;21(14):3598-607.
doi: 10.1093/emboj/cdf365.

Conformational changes in surface structures of isolated connexin 26 gap junctions

Affiliations

Conformational changes in surface structures of isolated connexin 26 gap junctions

Daniel J Müller et al. EMBO J. .

Abstract

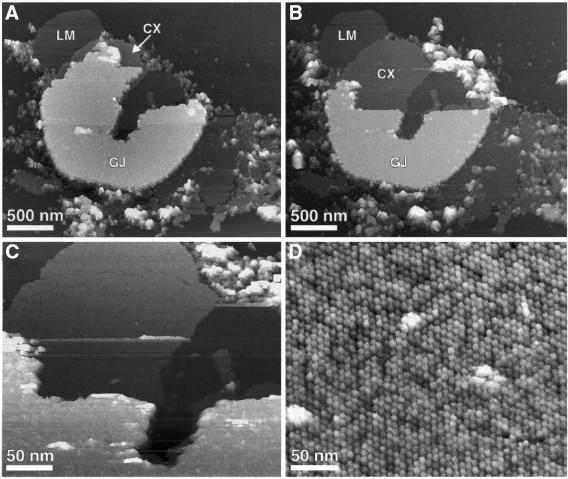
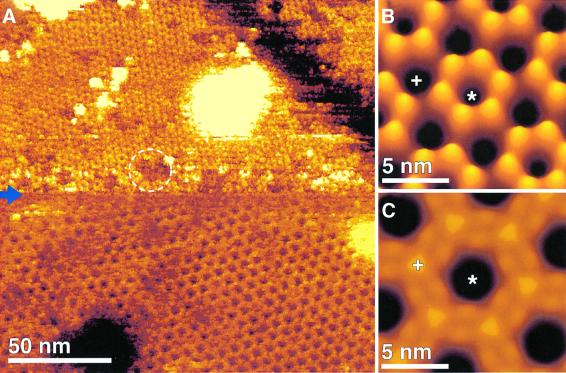
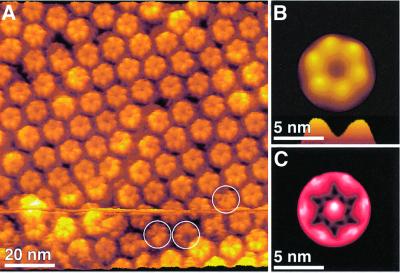
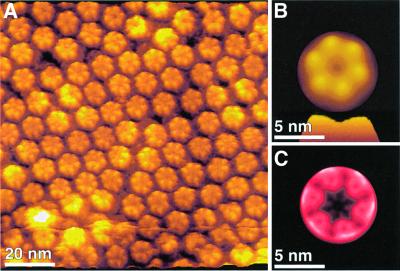
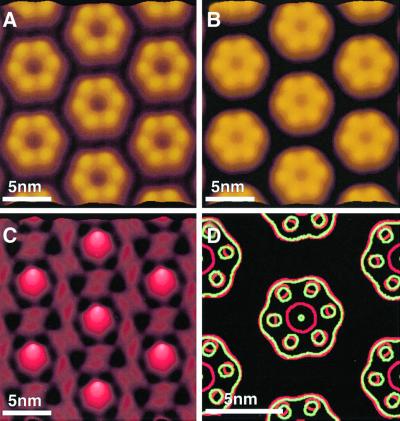
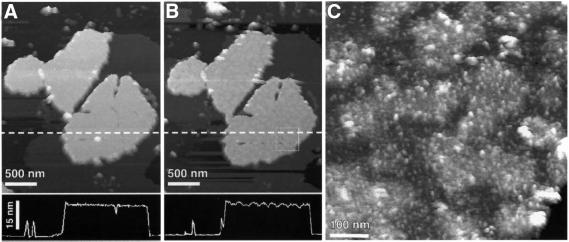
Gap junction channels mediate communication between adjacent cells. Using atomic force microscopy (AFM), we have imaged conformational changes of the cytoplasmic and extracellular surfaces of native connexin 26 gap junction plaques. The cytoplasmic domains of the gap junction surface, imaged at submolecular resolution, form a hexameric pore protruding from the membrane bilayer. Exhibiting an intrinsic flexibility, these cytoplasmic domains, comprising the C-terminal connexin end, reversibly collapse by increasing the forces applied to the AFM stylus. The extracellular connexon surface was imaged after dissection of the gap junction with the AFM stylus. Upon injection of Ca(2+) into the buffer solution, the extracellular channel entrance reduced its diameter from 1.5 to 0.6 nm, a conformational change that is fully reversible and specific among the divalent cations tested. Ca(2+) had a profound effect on the cytoplasmic surface also, inducing the formation of microdomains. Consequently, the plaque height increased by 0.6 nm to 18 nm. This suggests that calcium ions induce conformational changes affecting the structure of both the hemichannels and the intact channels forming cell-cell contacts.


Figures

None
Fig. 1. Gap junction plaque imaged in buffer solution using AFM. (A) Overview of a gap junction plaque (marked as GJ) surrounded by a lipid membrane (marked as LM) and fragments of single-layered connexon membranes (marked as CX). (B) The same gap junction plaque but partly dissected. The gap junction membrane was dissected by enhancing the applied force from ∼50 pN (imaging force) to ∼500 pN. After removal, the gap junction plaque was re-imaged at ∼50 pN. (C and D) Extracellular surface of the connexon membrane at elevated magnifications. The hexagonal arrangement of the connexons is clearly visible (D). Topographs were recorded in buffer solution (5 mM Tris, 1 mM EGTA, 1 mM PMSF) with a force of ∼50 pN applied to the AFM stylus and a line frequency of 4.4 Hz, and were displayed as relief tilted by 5°. Topographs exhibited a vertical full gray level scale of 25 nm (A–C) and 2.5 nm (D), and were displayed as relief tilted by 5%.
None
Fig. 2. Two conformations of the cytoplasmic gap junction surface. (A) AFM topograph demonstrating the variability of cytoplasmic gap junction domains. Individual gap junction domains appear disordered (circle). The initial applied force of 50 pN (top to center of image) was enhanced at the center of the topograph (blue arrow) to 70 pN (center to bottom of image). A conformational change is distinct: pore forming gap junction hexamers collapse onto the membrane surface, thereby transforming into pores with larger channel diameters. (B) Average of the extended conformation of gap junction exhibiting a lateral resolution of ∼2 nm. The cytoplasmic domains form a pore (asterisks) and protrude by 1.7 ± 0.2 nm (n = 30) above the lipid bilayer (cross). (C) Average of gap junction domains collapsed onto the membrane surface. Here the cytoplasmic domains protrude only by 0.2 ± 0.2 nm (n = 30) above the lipid bilayer (+). Topograph was recorded in Ca2+-free buffer solution (5 mM Tris, 1 mM EGTA and 1 mM PMSF) at a line frequency of 5 Hz. All topographs were displayed as relief tilted by 5°. Topographs exhibit a vertical full gray level scale of 3 nm (A), of 2 nm (B) and of 1 nm (C).
None
Fig. 3. Extracellular connexon surface recorded in a Ca2+-free buffer solution. (A) AFM topograph showing the connexon arrangement. Individual connexons exhibit defects of the size of single connexins as indicated by circles. (B) Average of the raw data shown in (A), exhibiting a lateral resolution of ∼1.2 nm. Connexin assembly of the connexon and the extracellular channel opening (profile at bottom) are clearly seen. (C) To access the flexibility of the structural details, a SD map of the average was calculated (Müller et al., 1998). The SD map had a range from 0.1 nm (black) to 0.4 nm (white), and is shown in black to red to white shades. The maximum SD value located at the connexon pore indicates an enhanced structural variability of this area. The topograph was recorded in buffer solution (5 mM Tris, 1 mM EGTA and 1 mM PMSF) at an applied force of 50 pN and a line frequency of 5.5 Hz, and has a vertical scale of 2 nm. All images were displayed as relief tilted by 5°.
None
Fig. 4. Ca2+-induced conformational change of the extracellular connexon surface. (A) Same connexon surface as imaged in Figure 3, but in the presence of 0.5 mM CaCl2. As visible in the raw data, individual connexons nearly closed their channel entrance. The average, exhibiting a lateral resolution of ∼1.2 nm (B), shows details of this structural change more clearly. The channel has changed significantly (profile at bottom of figure). Superposition of correlation average and SD map (C) allows assigning the channel entrance to be the most rigid structural element of the extracellular surface. The topograph was recorded in buffer solution (5 mM Tris, 0.5 mM CaCl2 and 1 mM PMSF) at an applied force of 50 pN and a line frequency of 5.5 Hz. While the topographs had a vertical range of 2 nm, the SD map extended from 0.1 to 0.3 nm. All images were displayed as relief tilted by 5°.
None
Fig. 5. Connexon surface as a function of Ca2+ concentration. Extracellular surfaces of connexons displayed in an idealized 2D lattice were recorded in the absence (A) and presence (B) of Ca2+. Correlation averages shown were calculated from several topographs recorded under equivalent conditions. The lateral resolution of the averages was limited to ∼1.5 nm. To visualize their differences, a difference map was calculated (C). (D) Superimposed contours of the two conformations (red, no Ca2+; green, with Ca2+). All presentations show that the most significant change is observed at the pore. The contour plots, however, show that in the presence of Ca2+ the connexin surface protrusions move towards the pore center. Note that the greatest difference is in the size of the pore. The images exhibiting a vertical gray level range of 2 nm (A and B) and 0.8 nm (C) were displayed as relief tilted by 5°.
None
Fig. 6. Ca2+-induced conformational change of the gap junction plaque. (A) The topograph was recorded in buffer solution (5 mM Tris and 1 mM PMSF) using contact mode AFM at an applied force of 50 pN and a line frequency of 4 Hz. (B) The same gap junction plaque after injection of 0.5 mM Ca2+ into the buffer solution. The gap junction surface formed islands of variable heights and the height of the plaque increased to 18 ± 0.9 nm (n = 33), by ∼0.6 nm. At higher magnification (C), an enhanced roughness of the buckled surface was observed. All topographs were recorded at an applied force of 50 pN and a line frequency between 4 and 5 Hz. The images exhibiting a vertical gray level range of 25 nm (A and B) and 5 nm (C) were displayed as relief tilted by 5°.

References

    1. Binnig G., Quate,C.F. and Gerber,C. (1986) Atomic force microscope. Phys. Rev. Lett., 56, 930–933. - PubMed
    1. Bukauskas F.F., Jordan,K., Bukauskiene,A., Bennett,M.V., Lampe,P.D., Laird,D.W. and Verselis,V.K. (2000) Clustering of connexin 43-enhanced green fluorescent protein gap junction channels and functional coupling in living cells. Proc. Natl Acad. Sci. USA, 97, 2556–2561. - PMC - PubMed
    1. Czajkowsky D.M. and Shao,Z. (1998) Submolecular resolution of single macromolecules with atomic force microscopy. FEBS Lett., 430, 51–54. - PubMed
    1. Dammer U., Hegner,M., Anselmetti,D., Wagner,P., Dreier,M., Huber,W. and Güntherodt,H.J. (1996) Specific antigen/antibody interactions measured by force microscopy. Biophys. J., 70, 2437–2441. - PMC - PubMed
    1. Delmar M., Stergiopoulos,K., Homma,N., Calero,G., Morley,G., Ek-Vitorin,J.F. and Taffet,S.M. (2000) A molecular model for the chemical regulation of connexin43 channels: the ‘ball and chain’ hypothesis in gap junctions. In Peracchia,C. (ed.), Molecular Basis of Cell Communication in Health and Disease. Academic Press, San Diego, CA, pp. 223–248.

Publication types