. 2002 Jul 15;21(14):3770-81.
doi: 10.1093/emboj/cdf368.

Transcription factor-mediated lineage switching reveals plasticity in primary committed progenitor cells

Affiliations

Transcription factor-mediated lineage switching reveals plasticity in primary committed progenitor cells

Clare Heyworth et al. EMBO J. .

Abstract

The developmental plasticity of transplanted adult stem cells challenges the notion that tissue-restricted stem cells have stringently limited lineage potential and prompts a re-evaluation of the stability of lineage commitment. Transformed cell systems are inappropriate for such studies, since transformation potentially dysregulates the processes governing lineage commitment. We have therefore assessed the stability of normal lineage commitment in primary adult haematopoietic cells. For these studies we have used prospectively isolated primary bipotent progenitors, which normally display only neutrophil and monocyte differentiation in vitro. In response to ectopic transcription factor expression, these neutrophil/monocyte progenitors were reprogrammed to take on erythroid, eosinophil and basophil-like cell fates, with the resultant colonies resembling the mixed lineage colonies normally generated by multipotential progenitors. Clone-marking and daughter cell experiments identified lineage switching rather than differential cell selection as the mechanism of altered lineage output. These results demonstrate that the cell type-specific programming of apparently committed primary progenitors is not irrevocably fixed, but may be radically re-specified in response to a single transcriptional regulator.


Figures
None
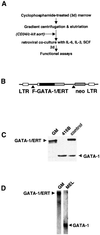
Fig. 1. Enforced expression of GATA-1/ERT in primary GM/CFC. (A) Purification and infection of GM-CFC from murine bone marrow. For some experiments, purified GM-CFC were further enriched on the basis of CD34+/c-kit+ antibody staining. (B) Retroviral construct. FLAG-tagged murine GATA-1 was fused in-frame to an ER ligand-binding domain mutagenized such that it is responsive to 4OHT rather than oestrogen (Littlewood et al., 1995; Heyworth et al., 1999) and inserted into the p-50-M-X-neo retroviral vector. Expression of both GATA-1/ERT and neo is under the control of the viral LTR and achieved through alternative splicing (▴). (C) Western blot analysis of the level of GATA-1/ERT and endogenous murine GATA-1 in retrovirally transduced GM-CFC (GM), compared with a myeloid progenitor cell line (416B) and a previously derived clone of FDCPmix cells stably infected with the same GATA-1/ERT retrovirus (control). (D) Northern blot analysis of GATA-1/ERT-transduced GM-CFC and a murine erythroleukaemia cell line (MEL) probed with a murine GATA-1 probe that recognizes both the retroviral GATA-1/ERT and endogenous GATA-1 mRNAs.
None
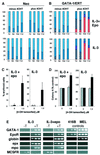
Fig. 2. Colony formation by retrovirally transduced GM-CFC. GM-CFC transduced with neo-only (A) or GATA-1/ERT (B) retroviruses were plated in soft agar with G418 ± 1 µM 4OHT, in IL-3 + epo or IL-3 alone. The results show the average distribution of each cell type per colony (%). Grey, blasts; dark blue, neutrophils; light blue, monocytes; purple, immature granulocytes of the basophil and eosinophil lineages; pink, erythroid. Basophil-like cells were identified on the basis of morphology and dark blue staining of the granules by Toluidine Blue. (C) Virally transduced CD34+/c-kit+ GM-CFC were plated in IL-3 + epo or IL-3 alone and grown for 8–9 days. The number of erythroid cells generated is shown, expressed as a percentage of the total cell number on a per colony basis (average of 4–8 experiments ± SEM). Grey bars, neo-transduced cultures; black bars, GATA-1/ERT-transduced cultures. (D) Average ± SEM of total colony number expressed as a percentage of the number of colonies formed in 0 µM 4OHT (control) in the experiments described in Figure 2C. Grey bars, neo-transduced cultures; black bars, GATA-1/ERT-transduced cultures. (E) Semi-quantitative RT–PCR analysis of RNA from pooled colonies formed by GATA-1/ERT-transduced CD34+/c-kit+ GM-CFC cultured in IL-3 or IL-3 + epo, without and with 4OHT (T). Controls: 416B and MEL cell lines. Oligo-dT-primed reverse transcription was performed using 20, 60 and 180 ng of input RNA (left to right) for each sample, followed by 25 cycles of gene-specific PCR.
None
Fig. 3. Analysis of individual colonies. (A and B) Gross morphology of colonies at day 9 from GATA-1/ERT-transduced CD34+/c-kit+ GM-CFC plated in IL-3 in the absence (A) or presence (B) of 4OHT. (C and D) Cellular composition of 12 randomly selected GATA-1/ERT colonies plated in the absence or presence of 4OHT (as indicated). Each pie chart represents the distribution of different cell types within an individual colony. Colours as in Figure 2. (E and F) The percentage of erythroid cells (E) and non-neutrophilic granulocytes (F) within 50 colonies formed by GATA-1/ERT-transduced GM-CFC, with the means indicated by horizontal bars. Colonies were grown in IL-3 or IL-3 + epo, and in the absence (–T) or presence (+T) of 1 µM 4OHT. The minor erythroid component occasionally seen on plating in IL-3 + epo – T is presumably due to some leakiness of the GATA-1/ERT activity. Typical fields from cellular cytospins of individual GATA-1/ERT colonies cultured in the absence (G) or presence (H and I) of 4OHT. (G and H) Staining with O-dianisidine (haemoglobin) and counterstaining with May–Grunwald–Giemsa and (I) staining with Luxol Blue (eosinophilic granules). Cell types are indicated as follows: a, monocytes; b, neutrophils; c, erythroblasts; d, non-neutrophilic granulocytes.
None
Fig. 4. Cellular composition of colonies generated by neo- or GATA-1/ERT-transduced CD34+/c-kit+ GM-CFC plated in the absence (–) or presence (+) of 40HT. Colonies were grown in stem cell factor (SCF), IL-3, IL-11, GM-CSF, epo and thrombopoietin (TPO). The mean average colony composition for each condition is shown, essentially as described by Akashi et al. (2000).
None
Fig. 5. Erythroid development in the absence of added erythropoietin. Time course of colony morphologies generated by GM-CFC infected with vector-only (A) or GATA-1/ERT (B) retroviruses. Cells were plated in GM-CSF and G418 in the absence or presence of 4OHT, and sampled at days 7, 9, 10 and 11 for morphological analysis. Relative cellular compositions are shown of 16 randomly selected individual colonies generated by (C) vector-only- and (D) GATA-1/ERT-infected GM-CFC plated with and without 4OHT. In this experiment, GM-CFC were not further purified by CD34+/c-kit+ sorting. Colours for cell morphology as in Figure 2.
None
Fig. 6. Kinetic studies of transcription factor-mediated lineage reprogramming. (A) GATA-1/ERT-transduced GM-CFC were pre-incubated in liquid culture in IL-3 in the absence (–T) or presence (+T) of 4OHT (1 µM) for 2 days. The cells were then washed and counted before plating in soft agar in G418 selection and IL-3, again in the absence (–T) or presence (+T) of 4OHT (1 µM). Individual colonies were picked and their morphology assessed at day 8. The cellular composition of individual colonies was expressed as a percentage of the total number of cells in the colony. Approximately 20–24 colonies were assessed from each of three independent experiments; the results were averaged and plotted as bar charts. (B) The number of colonies formed by cells pre-incubated in 4OHT for 2 days and then plated in the absence of 4OHT [(A), condition 3], plotted as a percentage of the number of colonies formed by cells pre-incubated and plated in the absence of 4OHT [(A), condition 1]. The results are the average of three experiments ± SEM. Grey bars, neo-transduced cells; black bars, GATA-1/ERT-transduced cells. It should be noted that in the absence of GATA-1/ERT activation there is a gradual decrease in colony formation as the pre-incubation period is increased. One day of pre-incubation in 4OHT results in an actual increase in the absolute colony numbers (∼2-fold), whilst after 2 days there appears to be a maintenance of colony number compared with the initial input cells. (C) Experimental scheme for colony marking experiments. GATA-1/ERT-transduced cells were split into three samples and plated in methylcellulose in the presence of G418 and various growth factors (day 0). After 2 days, emerging colonies were marked, 4OHT was added to sample 2 and the culture was continued until day 9. Note that sample 3 is essentially a control where 4OHT is present throughout the plating, as in previous experiments. (D) Colony morphologies analysed at day 9 for samples 1, 2 and 3 [as described in (C) and indicated above the chart] cultured in IL-3 (left panel) or IL-3 + epo (right panel). The time of addition of 4OHT is indicated beneath the chart.
None
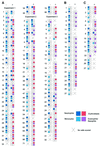
Fig. 7. Daughter cell assays. (A) Single GATA-1/ERT-transduced CD34+/c-kit+ GM-CFC were expanded for 2 days in IL-3 and the resulting mini-clones split into parallel suspension cultures in IL-3 without (–) and with (+) 4OHT. After a further 7 days, the cultures were cytospun and assessed for cell morphology. The compositions of all clones obtained in three independent experiments are shown. The presence of the major cell types is indicated by a filled box of the appropriate colour (see key). An open box indicates that cell type was not detected, although it should be noted that these cytospins often had relatively few cells. Failure to score cells (×) usually resulted from loss of cells at cytospin, although in some cases it was due to extensive cell death. The occasional culture displaying eosinophil, basophil or erythroid output in the absence of 4OHT may be due to leakiness of the GI/ERT activity, or to the presence of less mature cells at low frequency. (B) Mini-clones were generated as above, split and plated in methylcellulose containing SCF, IL-3, IL-11, GM-CSF, epo and TPO, in the absence (–) or presence (+) of 4OHT. After 10 days in clonal culture, individual colonies were picked, cytospun and assessed for cell morphology. The results are depicted as in (A). Clones generated in the presence of 4OHT displayed a multicentric morphology, consistent with a mixed lineage rather than GM composition; the failure to consistently detect neutrophils on cytospin analysis of the colonies reflects their initial low frequency and relative fragility in vitro. (C) The experiment described in (B) was repeated, but the initial mini-clones were generated in IL-3 + 4OHT. 4OHT was removed by washing the cells prior to plating in methylcellulose. Cell death accounted for the failure of scoring in clones 3, 22, 23, 26 and 27.

Similar articles

Cited by

References

    1. Akashi K., Traver,D., Miyamoto,T. and Weissman,I.L. (2000) A clonogenic common myeloid progenitor that gives rise to all myeloid lineages. Nature, 404, 193–197. - PubMed
    1. Anderson D.J., Gage,F.H. and Weissman,I.L. (2001) Can stem cells cross lineage boundaries? Nat. Med., 7, 393–395. - PubMed
    1. Borzillo G.V., Ashmun,R.A. and Sherr,C.J. (1990) Macrophage lineage switching of murine early pre-B lymphoid cells expressing transduced fms genes. Mol. Cell. Biol., 10, 2703–2714. - PMC - PubMed
    1. Choi J., Costa,M.L., Mermelstein,C.S., Chagas,C., Holtzer,S. and Holtzer,H. (1990) MyoD converts primary dermal fibroblasts, chondroblasts, smooth muscle, and retinal pigmented epithelial cells into striated mononucleated myoblasts and multinucleated myotubes. Proc. Natl Acad. Sci. USA, 87, 7988–7992. - PMC - PubMed
    1. Cook N., Dexter,T.M., Lord,B.I., Cragoe,E.J.,Jr and Whetton,A.D. (1989) Identification of a common signal associated with cellular proliferation stimulated by four haemopoietic growth factors in a highly enriched population of granulocyte/macrophage colony-forming cells. EMBO J., 8, 2967–2974. - PMC - PubMed

Publication types

MeSH terms