. 2002 Jul;136(6):837-46.
doi: 10.1038/sj.bjp.0704788.

FcepsilonRI cross-linking-induced actin assembly mediates calcium signalling in RBL-2H3 mast cells

Affiliations

FcepsilonRI cross-linking-induced actin assembly mediates calcium signalling in RBL-2H3 mast cells

Tatsuya Oka et al. Br J Pharmacol. 2002 Jul.

Abstract

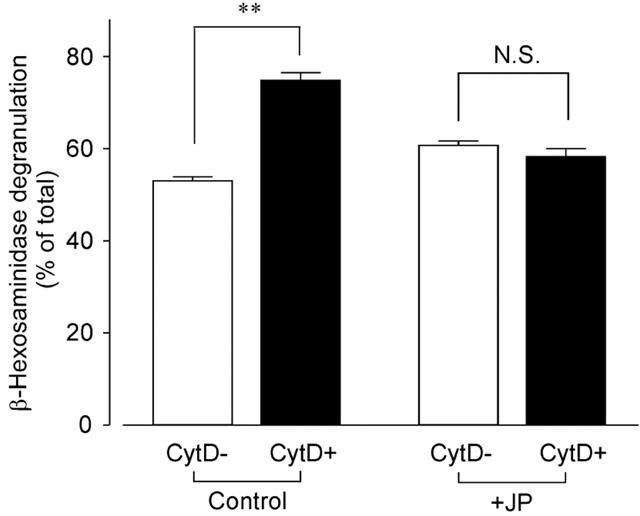
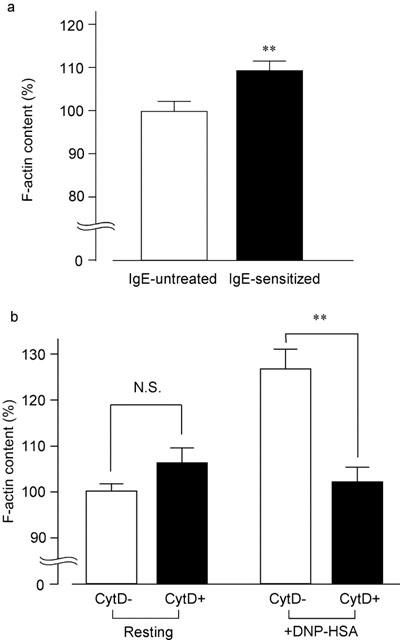
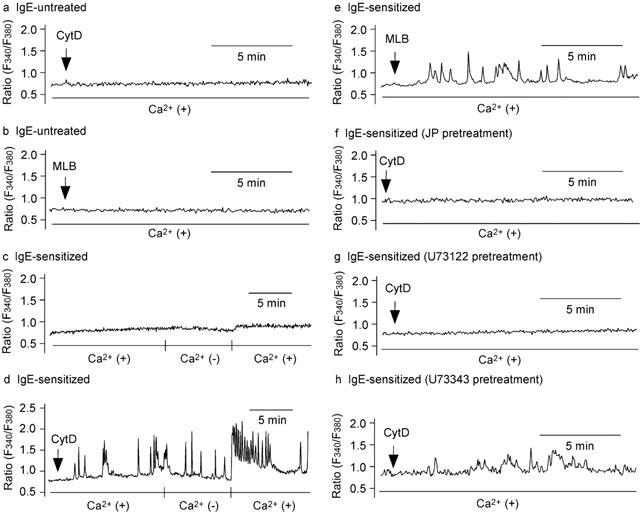
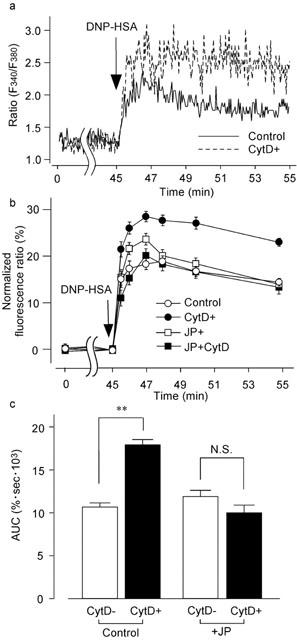
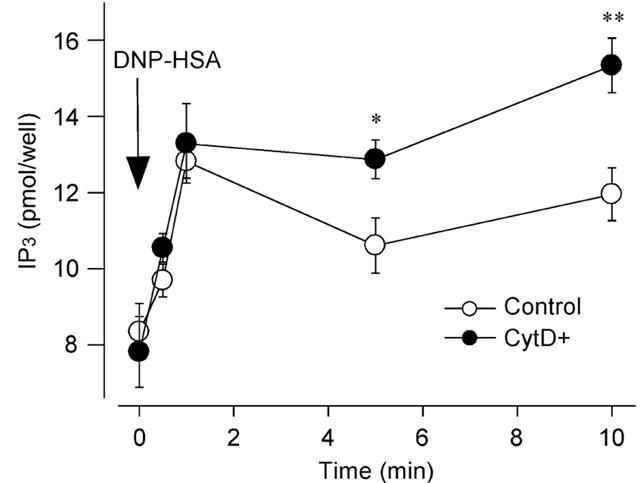
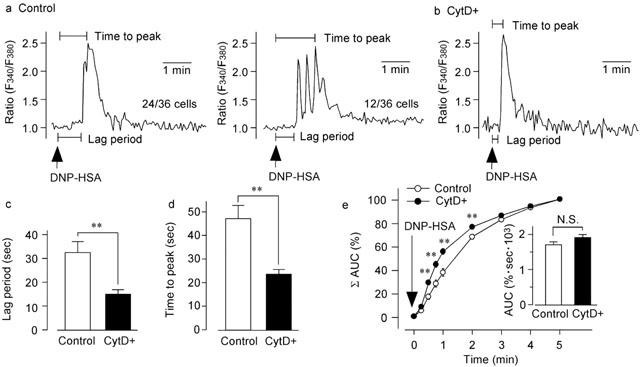
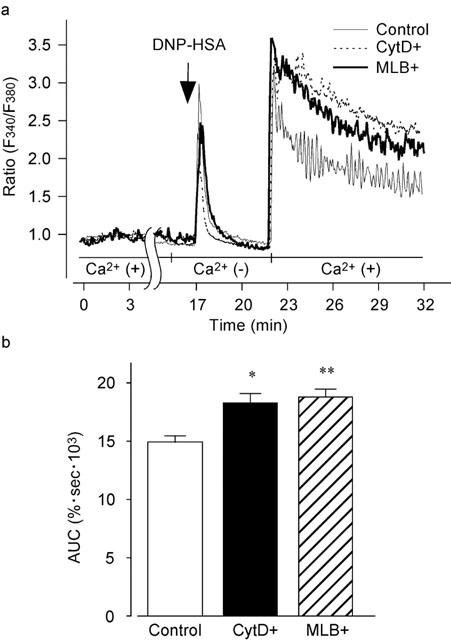
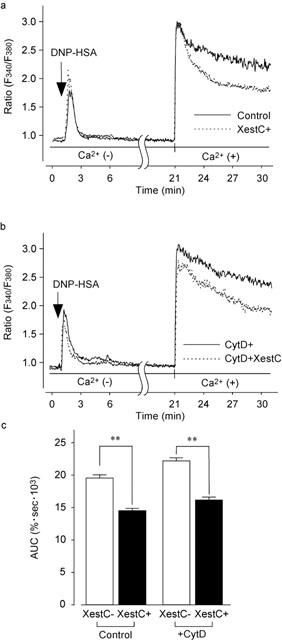
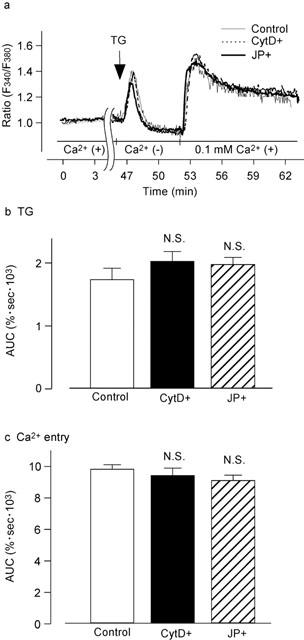
1. To determine the role of actin assembly in the Ca(2+) signalling of mast cells activated by cross-linking of FcepsilonRI, we examined the effects of cytochalasin D, an inhibitor of actin polymerization. 2. In the RBL-2H3 cells, F-actin content was increased by sensitization with anti-dinitrophenol (DNP) IgE. In these cells, cytochalasin D induced oscillatory increases in cytosolic Ca(2+) ([Ca(2+)](i)); these increase were inhibited by jasplakinolide, a stabilizer of actin filaments. 3. In the IgE-sensitized RBL-2H3 cells, DNP-human serum albumin (DNP-HSA) augmented actin assembly. DNP-HSA also increased the production of IP(3), [Ca(2+)](i) and degranulation. Cytochalasin D enhanced all of these DNP-HSA-induced effects. 4. In a Ca(2+)-free solution, DNP-HSA induced a transient increase in [Ca(2+)](i), and this increase was accelerated by cytochalasin D. After cessation of the DNP-HSA-induced Ca(2+) release, the re-addition of Ca(2+) induced a sustained increase in [Ca(2+)](i) through capacitative Ca(2+) entry (CCE), and this increase was enhanced by cytochalasin D. 5 The effect of cytochalasin D in enhancing the CCE activity was prevented by xestospongin C. 6. In contrast, neither the Ca(2+) release nor the CCE activation that was induced by thapsigargin was affected by cytochalasin D. 7. These results suggest that actin de-polymerization stimulates the FcepsilonRI-mediated signalling to augment the release of Ca(2+) from the endoplasmic reticulum in RBL-2H3 cells.


Figures

Figure 1
Figure 1
Effect of cytochalasin D on DNP-HSA-induced β-hexosaminidase degranulation. RBL-2H3 cells were preincubated without (Control) or with jasplakinolide (3 μM) for 45 min (+JP) in the presence (CytD+) or absence (CytD−) of cytochalasin D (300 nM) for the last 15 min followed by the addition of DNP-HSA (10 ng ml−1) for 30 min to induce degranulation. The percentages of released β-hexosaminidase were calculated against the total amount of β-hexosaminidase. Results are expressed as means±s.e.mean of 10–14 experiments. **Significantly different with P<0.01. N.S. Not significantly different.
Figure 2
Figure 2
Effect of cytochalasin D on DNP-HSA-induced F-actin polymerization. (a) RBL-2H3 cells were treated without (IgE-untreated) or with IgE (0.05 μg ml−1; IgE-sensitized) overnight. The F-actin content is shown as a percentage of the F-actin content in IgE-untreated cells. (b) IgE-sensitized RBL-2H3 cells were preincubated with (CytD+) or without cytochalasin D (300 nM) for 15 min (CytD−), followed by incubation without (Resting) or with DNP-HSA (10 ng ml−1) for 5 min (+DNP-HSA). The F-actin content is shown as a percentage of the F-actin content at the resting state. Results are expressed as means±s.e.mean of 8–20 experiments. **Significantly different with P<0.01. N.S. Not significantly different.
Figure 3
Figure 3
Effect of actin disassembly on [Ca2+]i in IgE-sensitized and untreated cells. Cytochalasin D (CytD) (300 nM) (a) or mycalolide B (MLB) (100 nM) (b) was added to the RBL-2H3 cells without a sensitization by anti-DNP IgE. The IgE-sensitized cells were incubated without (c) or with cytochalasin D for 15 min (d). Ca2+ was removed from the medium for 7 min, and re-added for 10 min. (e) The IgE-sensitized cells were incubated with mycalolide B for 15 min. (f) The IgE-sensitized cells were preincubated with jasplakinolide (JP) (3 μM) for 30 min and subsequently incubated with cytochalasin D for 15 min. The IgE-sensitized cells were preincubated with U73122 (g) or U73343 (h) for 10 min and subsequently incubated with cytochalasin D for 15 min. Typical recordings are shown (n=37–99).
Figure 4
Figure 4
Effect of actin disassembly on the DNP-HSA-induced increase in [Ca2+]i. (a) Typical recording of 10 ng ml−1 DNP-HSA-induced increase in [Ca2+]i in the fura-PE3-loaded RBL-2H3 cells without (Control) or with cytochalasin D (CytD+). Cells were preincubated with cytochalasin D (300 nM) for 15 min. (b) Quantified results of [Ca2+]i induced by DNP-HSA (10 ng ml−1). The RBL-2H3 cells were preincubated without (Control) or with jasplakinolide (3 μM) for 45 min (+JP) in the presence (CytD+) or absence (CytD−) of cytochalasin D (300 nM) for the last 15 min. (c) AUC for 10 min after the DNP-HSA stimulation. Results are expressed as means±s.e.mean of 34–49 cells. **Significantly different with P<0.01. N.S. Not significantly different.
Figure 5
Figure 5
Effect of cytochalasin D on DNP-HSA-induced IP3 production. Quantified results of IP3 production induced by DNP-HSA. The RBL-2H3 cells were preincubated without (Control) or with 300 nM cytochalasin D (CytD+) for 15 min. IP3 production was measured at ., 30 s, 1, 5 and 10 min after the DNP-HSA (10 ng ml−1) stimulation. Results are expressed as means±s.e.mean of six experiments. Significantly different with *P<0.05, **P<0.01.
Figure 6
Figure 6
Effect of cytochalasin D on DNP-HSA-induced Ca2+ release. (a) Typical recordings of 10 ng ml−1 DNP-HSA-induced Ca2+ release in the absence of extracellular Ca2+ and in the presence of 0.5 mM EGTA. DNP-HSA was applied 2 min after RBL-2H3 cells were exposed to Ca2+-free solution. (b) Typical recordings of DNP-HSA-induced Ca2+ release in the cells preincubated with cytochalasin D (300 nM) for 15 min. (c) Time between DNP-HSA stimulation and the first Ca2+ release (Lag period) in the cells preincubated without (Control) or with cytochalasin D (300 nM) for 15 min (CytD+). (d) Time between DNP-HSA stimulation and the [Ca2+]i peak (Time to peak) in the cells preincubated without (Control) or with cytochalasin D (300 nM) for 15 min (CytD+). (e) Normalized-piles of AUC of the DNP-HSA-induced Ca2+ release in the cells preincubated without (Control) or with cytochalasin D (300 nM) (CytD+). The total AUC for a 5 min DNP-HSA stimulation was taken as 100%. Inset: AUC for 5 min after DNP-HSA stimulation of the cells preincubated without (Control) or with cytochalasin D (CytD+). Results are expressed as means±s.e.mean of 33–36 cells. **Significantly different with P<0.01. N.S. Not significantly different.
Figure 7
Figure 7
Augmentation of DNP-HSA-induced Ca2+ influx by actin disassembly. (a) The fura-PE3-loaded RBL-2H3 cells were treated with 300 nM cytochalasin D (CytD+), 100 nM mycalolide B (MLB+) or with neither agent (Control) in normal HEPES buffered solution for 15 min. After stimulation with DNP-HSA (10 ng ml−1) for 5 min in the absence of Ca2+ (with 0.5 mM EGTA), 1.5 mM Ca2+ was added to the medium without EGTA. Typical recordings are shown in panel a. (b) AUC for 10 min after the addition of 1.5 mM Ca2+. Results are expressed as means±s.e.mean of 27–57 cells. Significantly different with *P<0.05, **P<0.01.
Figure 8
Figure 8
Augmentation of DNP-HSA-induced Ca2+ influx by actin disassembly and its inhibition by xestospongin C. (a) The fura-PE3-loaded RBL-2H3 cells were stimulated with DNP-HSA (10 ng ml−1) in a Ca2+-free solution for 5 min. The cells were subsequently incubated without (Control) or with xestospongin C (10 μM) for 15 min (XestC+). Then 1.5 mM Ca2+ was added to external space. Typical recordings are shown in panel a. (b) The fura-PE3-loaded RBL-2H3 cells were stimulated with DNP-HSA (10 ng ml−1) in the Ca2+-free solution for 5 min. The cells were subsequently incubated with cytochalasin D (300 nM), and without (CytD+) or with xestospongin C (10 μM) for 15 min (CytD+XestC). Then 1.5 mM Ca2+ was added to external space. Typical recordings are shown in panel b. (c) AUC for 10 min after the addition of Ca2+. Results are expressed as means±s.e.mean of 37–45 cells. Significantly different with **P<0.01.
Figure 9
Figure 9
Effect of actin disassembly on the thapsigargin-induced increase in [Ca2+]i. (a) The fura-PE3-loaded RBL-2H3 cells were treated without (Control) or with 300 nM cytochalasin D for 15 min (CytD+) or 3 μM jasplakinolide for 45 min (JP+). The cells were subsequently stimulated with 100 nM thapsigargin (TG) for 5 min in the absence of Ca2+ (with 0.5 mM EGTA). Then 0.1 mM Ca2+ was added to the medium without EGTA. Note that 0.1 mM Ca2+, instead of 1.5 mM Ca2+, was applied to the medium in this series of experiments because capacitative Ca2+ entry (CCE) was strongly and maximally activated by thapsigargin. Typical traces are shown in panel a. (b) AUC for 5 min after stimulation with thapsigargin. (c) AUC for 10 min after the addition of 0.1 mM Ca2+. Results are expressed as means±s.e.mean of 29–37 cells. N.S. Not significantly different.

Similar articles

Cited by

References

    1. AKETANI S., TESHIMA R., UMEZAWA Y., SAWADA J. Correlation between cytosolic calcium concentration and degranulation in RBL-2H3 cells in the presence of various concentrations of antigen-specific IgEs. Immunol. Lett. 2001;75:185–189. - PubMed
    1. BARKALOW K., HARTWIG J.H. The role of actin filament barbed-end exposure in cytoskeletal dynamics and cell motility. Biochem. Soc. Trans. 1995;23:451–456. - PubMed
    1. BERRIDGE M.J. Inositol trisphosphate and calcium signalling. Nature. 1993;361:315–325. - PubMed
    1. CARLIER M.F., PANTALONI D. Control of actin dynamics in cell motility. J. Mol. Biol. 1997;269:459–467. - PubMed
    1. CLAPHAM D.E. Intracellular calcium. Replenishing the stores. Nature. 1995;375:634–635. - PubMed

Publication types

MeSH terms

LinkOut - more resources