

The Epstein-Barr virus oncogene product, latent membrane protein 1, induces the downregulation of E-cadherin gene expression via activation of DNA methyltransferases
- PMID: 12110730
- PMCID: PMC126628
- DOI: 10.1073/pnas.152059399
The Epstein-Barr virus oncogene product, latent membrane protein 1, induces the downregulation of E-cadherin gene expression via activation of DNA methyltransferases
Abstract
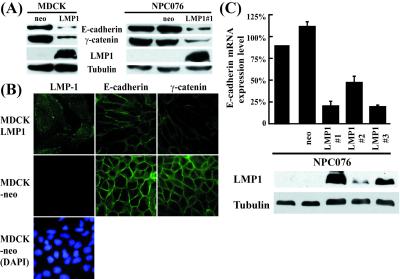
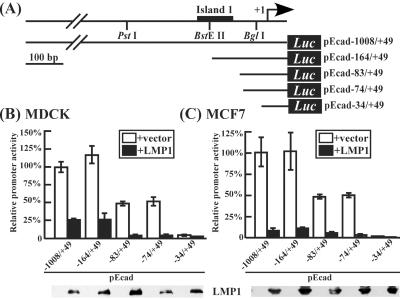
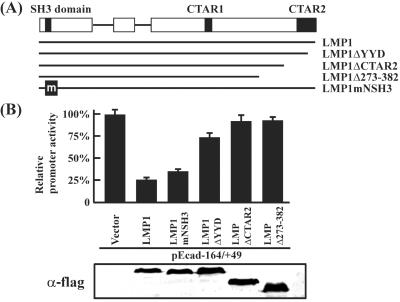
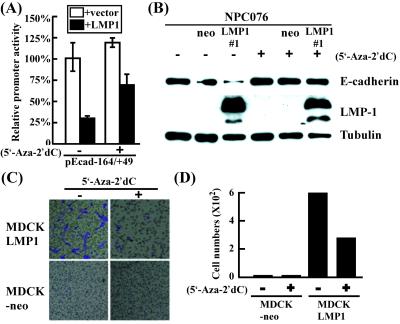
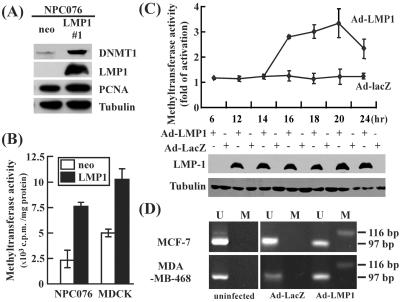
The latent membrane protein (LMP1) of Epstein-Barr virus (EBV) is expressed in EBV-associated nasopharyngeal carcinoma, which is notoriously metastatic. Although it is established that LMP1 represses E-cadherin expression and enhances the invasive ability of carcinoma cells, the mechanism underlying this repression remains to be elucidated. In this study, we demonstrate that LMP1 induces the expression and activity of the DNA methyltransferases 1, 3a, and 3b, using real-time reverse transcription-PCR and enzyme activity assay. This results in hypermethylation of the E-cadherin promoter and down-regulation of E-cadherin gene expression, as revealed by methylation-specific PCR, real-time reverse transcription-PCR and Western blotting data. The DNA methyltransferase inhibitor, 5'-Aza-2'dC, restores E-cadherin promoter activity and protein expression in LMP1-expressing cells, which in turn blocks cell migration ability, as demonstrated by the Transwell cell migration assay. Our findings suggest that LMP1 down-regulates E-cadherin gene expression and induces cell migration activity by using cellular DNA methylation machinery.
Figures
Similar articles
-
Activation of DNA methyltransferase 1 by EBV LMP1 Involves c-Jun NH(2)-terminal kinase signaling.Cancer Res. 2006 Dec 15;66(24):11668-76. doi: 10.1158/0008-5472.CAN-06-2194. Cancer Res. 2006. PMID: 17178861
-
Telomerase activation by Epstein-Barr virus latent membrane protein 1 is associated with c-Myc expression in human nasopharyngeal epithelial cells.J Exp Clin Cancer Res. 2004 Sep;23(3):495-506. J Exp Clin Cancer Res. 2004. PMID: 15595642
-
Hypermethylation of epithelial-cadherin gene promoter is associated with Epstein-Barr virus in nasopharyngeal carcinoma.Cancer Detect Prev. 2008;32(2):127-34. doi: 10.1016/j.cdp.2008.05.005. Epub 2008 Jul 15. Cancer Detect Prev. 2008. PMID: 18632221
-
EBV(LMP1)-induced metabolic reprogramming inhibits necroptosis through the hypermethylation of the RIP3 promoter.Theranostics. 2019 Apr 13;9(9):2424-2438. doi: 10.7150/thno.30941. eCollection 2019. Theranostics. 2019. PMID: 31131045 Free PMC article.
-
Interferon regulatory factor 7 regulates expression of Epstein-Barr virus latent membrane protein 1: a regulatory circuit.J Virol. 2003 Sep;77(17):9359-68. doi: 10.1128/jvi.77.17.9359-9368.2003. J Virol. 2003. PMID: 12915551 Free PMC article.
Cited by
-
Hepatitis B virus infection in hepatocellular carcinoma tissues upregulates expression of DNA methyltransferases.Int J Clin Exp Med. 2015 Mar 15;8(3):4175-85. eCollection 2015. Int J Clin Exp Med. 2015. PMID: 26064328 Free PMC article.
-
Human tumour viruses and the deregulation of cell polarity in cancer.Nat Rev Cancer. 2012 Dec;12(12):877-86. doi: 10.1038/nrc3400. Nat Rev Cancer. 2012. PMID: 23175122 Review.
-
Promoter hypermethylation in primary squamous cell carcinoma of the oral cavity and oropharynx: a study of a Brazilian cohort.Mol Biol Rep. 2012 Dec;39(12):10111-9. doi: 10.1007/s11033-012-1885-4. Epub 2012 Aug 31. Mol Biol Rep. 2012. PMID: 22936053
-
EBV latent membrane protein 1 abundance correlates with patient age but not with metastatic behavior in north African nasopharyngeal carcinomas.Virol J. 2005 Apr 20;2:39. doi: 10.1186/1743-422X-2-39. Virol J. 2005. PMID: 15842731 Free PMC article.
-
Cellular sheddases are induced by Merkel cell polyomavirus small tumour antigen to mediate cell dissociation and invasiveness.PLoS Pathog. 2018 Sep 6;14(9):e1007276. doi: 10.1371/journal.ppat.1007276. eCollection 2018 Sep. PLoS Pathog. 2018. PMID: 30188954 Free PMC article.
References
-
- Takeichi M. Science. 1991;251:1451–1455. - PubMed
-
- Momparler R L, Bovenzi V. J Cell Physiol. 2000;183:145–154. - PubMed
-
- Lou P J, Chen W P, Sheen T S, Ko J Y, Hsu M M, Wu J C. Oncol Report. 1999;6:1065–1071. - PubMed
-
- Zheng Z, Pan J, B, Chu B, Wong Y C, Cheung A L, Tsao S W. Hum Pathol. 1999;30:458–466. - PubMed
Publication types
MeSH terms
Substances
LinkOut - more resources
Full Text Sources
Other Literature Sources
Research Materials
