. 2002 Jul 23;99(15):10120-5.
doi: 10.1073/pnas.152266799. Epub 2002 Jul 11.

Retrograde trans-synaptic transfer of green fluorescent protein allows the genetic mapping of neuronal circuits in transgenic mice

Affiliations

Retrograde trans-synaptic transfer of green fluorescent protein allows the genetic mapping of neuronal circuits in transgenic mice

Uwe Maskos et al. Proc Natl Acad Sci U S A. .

Abstract

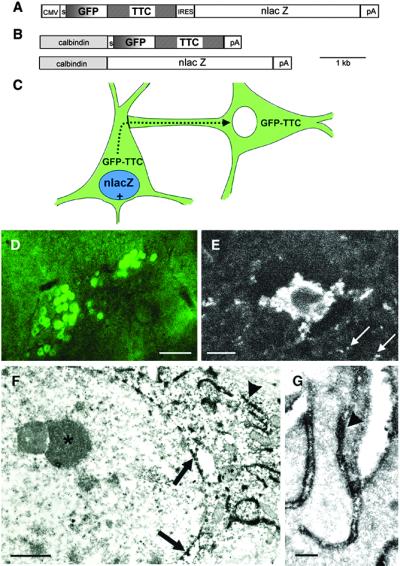
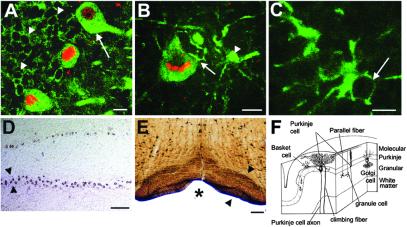
The function of the nervous system is a consequence of the intricate synaptic connectivity of its neurons. Our understanding of these highly complex networks has profited enormously from methods used over the past two decades that are based on the mechanical injection of tracer molecules into brain regions. We have developed a genetic system for the mapping of synaptic connections during development of the mammalian central nervous system and in the mature brain. It is based on the transsynaptic transfer of green fluorescent protein (GFP) in the brains of mice using a fusion protein with a nontoxic fragment of tetanus toxin (TTC) expressed in defined neurons. These transgenic mice allowed us to visualize neurons, at single-cell resolution, that are in synaptic contact by the detection of GFP in interconnected circuits. Targeted genetic expression with a specific promoter permitted us to transfer GFP to defined subsets of neurons and brain regions. GFP-TTC is coexpressed with a lacZ reporter gene to discriminate neurons that produce the tracer from cells that have acquired it transneuronally. The marker shows selective transfer in the retrograde direction. We have used electron microscopic detection of GFP to define the ultrastructural features of the system. Our work opens up a range of possibilities for brain slice and in vivo studies taking advantage of the fluorescence of GFP. We point the way toward the use of powerful multiphoton technology and set the stage for the transsynaptic transfer of other proteins in the brains of mice.


Figures

Figure 1
Figure 1
Basic description of the transsynaptic transfer system in transgenic mice. (A) Construct used for the generation of the CMV transgenic line: A CMV promoter drives expression of GFP–TTC, followed by an IRES sequence to coexpress nlacZ. (B) A calbindin promoter fragment is used to coexpress GFP–TTC and nlacZ. (C) Schematic of the transgenic strategy for mapping neuronal connections. Neurons expressing the transgenes are positive for lacZ as a nuclear marker (in blue) and fluorescent (in green) because of the expression of GFP–TTC. Neurons in synaptic contact receive the fusion protein (in green) but are β-gal negative. (D) Heavily GFP-positive neurons in the brainstem of line Cal3 detected with a 10× objective in a 70-μm slice by using FITC optics. (Scale bar, 100 μm.) (E) Strongly positive neuron, and surrounding neuropil (arrows), in the cortex of line Cal5 detected with a Zeiss two-photon microscope deep in a living slice. (Scale bar, 10 μm.) (F) Electron microscopic codetection of the GFP–TTC and β-gal proteins. Slices of a calbindin transgenic brain were stained with X-Gal, and then with an antibody to GFP followed by ABC peroxidase (16). The X-Gal staining gives small crystals in a perinuclear location (arrows), whereas the DAB stains dark in convoluted stacks of ER outside of the nucleus (arrowhead). Inside of the nucleus dense chromatin and a nucleolus are visible (asterisk). (Scale bar, 1 μm.) (G) High-power electron microscopy reveals the localization of the DAB reaction product indicative of the fusion protein at the inside of the ER lumen (arrowhead). (Scale bar, 250 nm.)
Figure 2
Figure 2
Marker-protein expression during development and analysis of transfer properties. (A) β-gal expression in line CMV5 at E16.5. In toto coloration. Indicated are the vibrissae (v), cochlea and semicircular canal (csc), roof of midbrain (rm), and medulla oblongata (mo). The arrow points to X-Gal stained olfactory epithelium. (B) Confocal image of GFP–TTC in a developing cortical neuron at embryonic day 15.5 in line Cal2. A 20-μm section was viewed at 488 nm confocal illumination. (Scale bar, 5 μm.) (C) A developing cortical neuron at embryonic day 15.5 double-labeled by X-Gal, in blue, and GFP IHC (brown), demonstrating colocalization of the two signals in the same cells. (Scale bar, 10 μm.) (D) Olfactory epithelium of line CMV5 showing strong expression of GFP–TTC in ORN neurons. Confocal analysis. (Scale bar, 10 μm.) Asterisk marks nasal cavity. (E) Absence of GFP antibody staining in the main olfactory bulb (MOB), outlined by arrowheads. Analysis as in C. (Scale bar, 250 μm.) (F) A schematic representation of the olfactory circuit (modified from ref. 21). M/T, mitral and tufted cells projecting to olfactory cortex; Gr, granule neurons receiving input from olfactory cortex; P, periglomerular neurons; ORN, olfactory receptor neurons in the olfactory epithelium. (G) Low-power confocal image of the olfactory bulb of a typical calbindin line. GFP fluorescence is detected as in B, and an antibody to β-gal has been used to double-label neurons at the origin of expression, followed by Texas red-coupled secondary antibody (red). (Scale bar, 100 μm.) (H) High-power confocal analysis of olfactory bulb granule cells showing high levels of GFP detected as in B. (Scale bar, 10 μm.) (I) DAB IHC, after X-Gal staining, of a section of olfactory cortex (outlined by arrowheads) in a P0 mouse of the same calbindin line. Note absence of specific blue X-Gal, and absence of specific brown DAB peroxidase label by using a sensitive anti-GFP antibody. (Scale bar, 100 μm.) (J) Olfactory cortex in a P15 mouse of the same line, analyzed as in I. Note absence of specific blue X-Gal, but strong, specific, dark brown DAB label indicating transfer of GFP–TTC at this age. (Scale bar, 40 μm.) (K) GFP fluorescence in the olfactory cortex detected in an adult mouse of line Cal3. Note absence of red lacZ signal after antibody to β-gal. (Scale bar, 10 μm.)
Figure 3
Figure 3
Detailed analysis of calbindin transgenic mice. (A) Confocal image of a stained section of cerebellum. The Purkinje cells express high levels of GFP–TTC (arrow) and are double-labeled with an antibody to β-gal (red) that, as a stationary marker, identifies the cell where GFP–TTC protein is produced. Transfer of GFP–TTC can be visualized to cerebellar granule cells, the small ovoid neurons with dark nuclei lying below the Purkinje cells in their characteristic internal granular layer of the cerebellum, see F. Individual GFP positive granule cells are marked by arrowheads. (Scale bar, 20 μm.) (B) Transfer of GFP from a double-labeled Purkinje cell to an adjacent, strongly labeled basket cell, arrowhead. The putative site of synaptic contact between the two cells is marked by an arrow. Analysis was as in A. (Scale bar, 20 μm.) (C) Confocal analysis of a cerebellar Golgi neuron labeled with GFP. It is identified by its location and specific morphology. Note the absence of β-gal in the nucleus, arrow. Analysis as in A. (Scale bar, 20 μm.) (D) In situ hybridization (16) with a riboprobe complementary to GFP. Only the Purkinje cells are labeled. The Purkinje cell layer is outlined by arrowheads. Note the absence of signal elsewhere. (Scale bar, 200 μm.) (E) A section of brainstem analyzed as in Fig. 2C. Strong signal is detectable in the inferior olive, outlined by arrowheads, a major source of afferents to cerebellar Purkinje cells, see Fig. 3F. (Scale bar, 100 μm.) Asterisk marks basilar artery. (F) A scheme summarizing the retrograde transsynaptic transfer in the cerebellar system (modified from ref. 23), with an indication of the different cerebellar cell layers on the right, i.e., Molecular layer, Purkinje cell layer, and granular layer.
Figure 4
Figure 4
Efficiency of transfer in calbindin transgenic mice. (A) Outline of the hippocampal system (modified from ref. 21), with an indication of axonal innervation of CA1 pyramidal cells by CA3 pyramidal cells (second-order neurons), that are in turn innervated by granule cells (third-order neurons). BE are arranged in the same orientation as this scheme, to facilitate the identification of structures. (B) Fluorescence detection of GFP in a CA1 pyramidal cell and its major dendrite, with putative passage of the GFP into axons of the Schaffer collaterals, outlined by arrowheads. (Scale bar, 20 μm.) (C) Low-power confocal image of the hippocampal CA3 area, source of the Schaffer collaterals. GFP is detected in the somata. Analysis as in Fig. 3A. (Scale bar, 20 μm.) (D) X-Gal histochemistry and antibody to GFP in the hippocampal dentate gyrus to detect granule cells receiving GFP. Note absence of specific X-Gal labeling, but positive DAB signal in many dentate granule cells (arrows) indicating transfer of GFP–TTC to third-order neurons. (Scale bar, 30 μm.) (E) In situ hybridization to an adjacent section to demonstrate absence of GFP expression in thalamus (th), presence in cortex (ctx) and hippocampal CA1, and absence in hippocampal CA3 and dentate gyrus (dg). (Scale bar, 200 μm.)

References

    1. Vercelli A, Repici M, Garbossa D, Grimaldi A. Brain Res Bull. 2000;51:11–28. - PubMed
    1. Montecucco C, Schiavo G. Q Rev Biophys. 1995;28:423–472. - PubMed
    1. Coen L, Osta R, Maury M, Brûlet P. Proc Natl Acad Sci USA. 1997;94:9400–9405. - PMC - PubMed
    1. Miana-Mena F J, Roux S, Bénichou J-C, Osta R, Brûlet P. Proc Natl Acad Sci USA. 2002;99:3234–3239. - PMC - PubMed
    1. Chalfie M, Tu Y, Euskirchen G, Ward W W, Prasher D C. Science. 1994;263:802–805. - PubMed

Publication types

MeSH terms