Effect of yeast CTA1 gene expression on response of tobacco plants to tobacco mosaic virus infection
- PMID: 12114558
- PMCID: PMC166498
- DOI: 10.1104/pp.010960
Effect of yeast CTA1 gene expression on response of tobacco plants to tobacco mosaic virus infection
Abstract
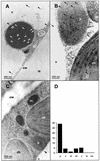
The response of tobacco (Nicotiana tabacum L. cv Xanthi-nc) plants with elevated catalase activity was studied after infection by tobacco mosaic virus (TMV). These plants contain the yeast (Saccharomyces cerevisiae) peroxisomal catalase gene CTA1 under the control of the cauliflower mosaic virus 35S promoter. The transgenic lines exhibited 2- to 4-fold higher total in vitro catalase activity than untransformed control plants under normal growth conditions. Cellular localization of the CTA1 protein was established using immunocytochemical analysis. Gold particles were detected mainly inside peroxisomes, whereas no significant labeling was detected in other cellular compartments or in the intercellular space. The physiological state of the transgenic plants was evaluated in respect to growth rate, general appearance, carbohydrate content, and dry weight. No significant differences were recorded in comparison with non-transgenic tobacco plants. The 3,3'-diaminobenzidine-stain method was applied to visualize hydrogen peroxide (H(2)O(2)) in the TMV infected tissue. Presence of H(2)O(2) could be detected around necrotic lesions caused by TMV infection in non-transgenic plants but to a much lesser extent in the CTA1 transgenic plants. In addition, the size of necrotic lesions was significantly bigger in the infected leaves of the transgenic plants. Changes in the distribution of H(2)O(2) and in lesion formation were not reflected by changes in salicylic acid production. In contrast to the local response, the systemic response in upper noninoculated leaves of both CTA1 transgenic and control plants was similar. This suggests that increased cellular catalase activity influences local but not systemic response to TMV infection.
Figures
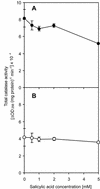
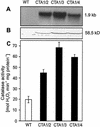
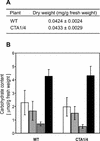
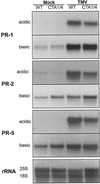
 , Suc; ▪, starch). The results are arithmetic means with
error bars representing the




Similar articles
-
Over-expression of a scopoletin glucosyltransferase in Nicotiana tabacum leads to precocious lesion formation during the hypersensitive response to tobacco mosaic virus but does not affect virus resistance.Plant Mol Biol. 2004 Jan;54(1):137-46. doi: 10.1023/B:PLAN.0000028775.58537.fe. Plant Mol Biol. 2004. PMID: 15159640
-
Expression of a beta-glucosidase gene results in increased accumulation of salicylic acid in transgenic Nicotiana tabacum cv. Xanthi-nc NN genotype.Plant Cell Rep. 2007 Mar;26(3):291-301. doi: 10.1007/s00299-006-0212-8. Epub 2006 Nov 3. Plant Cell Rep. 2007. PMID: 17082925
-
Down-regulation of antioxidative capacity in a transgenic tobacco which fails to develop acquired resistance to necrotization caused by TMV.Free Radic Res. 2002 Sep;36(9):981-91. doi: 10.1080/1071576021000006581. Free Radic Res. 2002. PMID: 12448824
-
Local lesions and induced resistance.Adv Virus Res. 2009;75:73-117. doi: 10.1016/S0065-3527(09)07503-4. Epub 2010 Jan 13. Adv Virus Res. 2009. PMID: 20109664 Review.
-
Spicing Up the N Gene: F. O. Holmes and Tobacco mosaic virus Resistance in Capsicum and Nicotiana Plants.Phytopathology. 2017 Feb;107(2):148-157. doi: 10.1094/PHYTO-07-16-0264-RVW. Epub 2016 Nov 30. Phytopathology. 2017. PMID: 27642796 Review.
Cited by
-
Salicylic acid is an indispensable component of the Ny-1 resistance-gene-mediated response against Potato virus Y infection in potato.J Exp Bot. 2014 Mar;65(4):1095-109. doi: 10.1093/jxb/ert447. Epub 2014 Jan 13. J Exp Bot. 2014. PMID: 24420577 Free PMC article.
-
Fatty acid hydroperoxides and H2O2 in the execution of hypersensitive cell death in tobacco leaves.Plant Physiol. 2005 Jul;138(3):1516-26. doi: 10.1104/pp.105.059907. Epub 2005 Jun 24. Plant Physiol. 2005. PMID: 15980200 Free PMC article.
-
An Engineered Distant Homolog of Pseudomonas syringae TTSS Effector From Physcomitrella patens Can Act as a Bacterial Virulence Factor.Front Microbiol. 2018 Jun 20;9:1060. doi: 10.3389/fmicb.2018.01060. eCollection 2018. Front Microbiol. 2018. PMID: 29973916 Free PMC article.
-
A Cotton Cyclin-Dependent Kinase E Confers Resistance to Verticillium dahliae Mediated by Jasmonate-Responsive Pathway.Front Plant Sci. 2018 May 24;9:642. doi: 10.3389/fpls.2018.00642. eCollection 2018. Front Plant Sci. 2018. PMID: 29881391 Free PMC article.
-
Phosphorylation of HopQ1, a type III effector from Pseudomonas syringae, creates a binding site for host 14-3-3 proteins.Plant Physiol. 2013 Apr;161(4):2049-61. doi: 10.1104/pp.112.209023. Epub 2013 Feb 8. Plant Physiol. 2013. PMID: 23396834 Free PMC article.
References
-
- Aebi H. Formation and Removal of Oxygen Radicals. Methods Enzymol 105: 121–126. 1984. Catalase in vitro. - PubMed
-
- Alvarez ME, Pennell RI, Meijer PJ, Ishikawa A, Dixon RA, Lamb C. Reactive oxygen intermediates mediate a systemic signal network in the establishment of plant immunity. Cell. 1998;92:773–784. - PubMed
-
- Anderson M, Chen Z, Klessig DF. Possible involvement of lipid peroxidation in salicylic acid-mediated induction of PR-1 gene expression. Phytochemistry. 1998;47:555–566.
Publication types
MeSH terms
Substances
LinkOut - more resources
Full Text Sources
Molecular Biology Databases

