

Selective activation of the developmentally regulated Ha hsp17.6 G1 promoter by heat stress transcription factors
- PMID: 12114574
- PMCID: PMC166514
- DOI: 10.1104/pp.010927
Selective activation of the developmentally regulated Ha hsp17.6 G1 promoter by heat stress transcription factors
Abstract
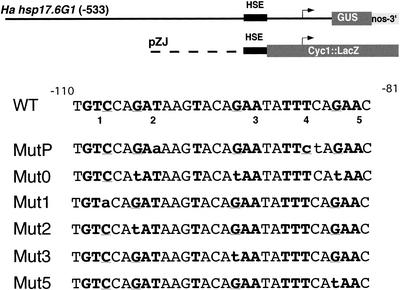
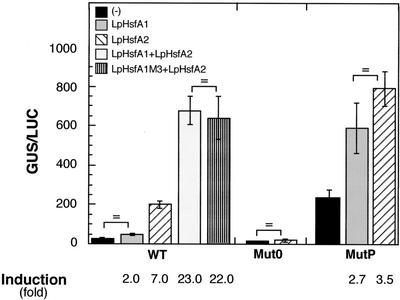
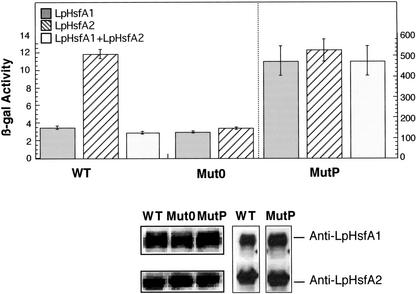
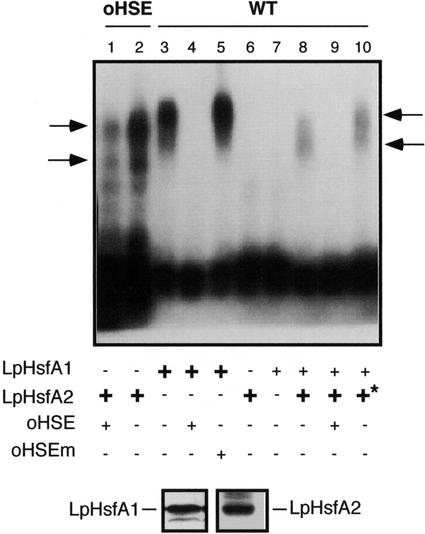
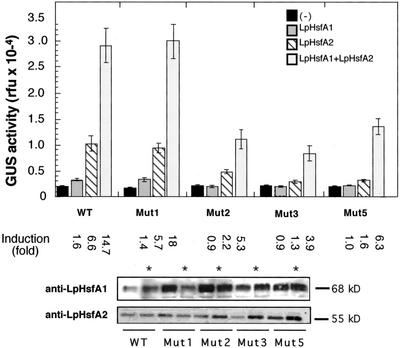
Using two well-characterized heat stress transcription factors (Hsfs) from tomato (Lycopersicon peruvianum; LpHsfA1 and LpHsfA2), we analyzed the transcriptional activation of the Ha hsp17.6 G1 promoter in sunflower (Helianthus annuus) embryos. In this system, we observed transient promoter activation only with LpHsfA2. In contrast, both factors were able to activate mutant versions of the promoter with improved consensus Hsf-binding sites. Exclusive activation by LpHsfA2 was also observed in yeast (Saccharomyces cerevisiae) without other Hsfs and with a minimal Cyc1 promoter fused to the Ha hsp17.6 G1 heat stress cis-element. Furthermore, the same promoter mutations reproduced the loss of activation selectivity, as observed in sunflower embryos. The results of in vitro binding experiments rule out differential DNA binding of the two factors as the explanation for the observed differential activation capacity. We conclude that the specific sequence of this heat stress cis-element is crucial for Hsf promoter selectivity, and that this selectivity could involve preferential transcriptional activation following DNA binding. In sunflower embryos, we also observed synergistic transcriptional activation by co-expression of LpHsfA1 and LpHsfA2. Mutational analyses of the Ha hsp17.6 G1 promoter, combined with in vitro binding assays, suggest that mixed oligomers of the two factors may be involved in promoter activation. We discuss the relevance of our observations for mechanisms of developmental regulation of plant heat stress protein genes.
Figures
Similar articles
-
Functional interaction between two transcription factors involved in the developmental regulation of a small heat stress protein gene promoter.Plant Physiol. 2005 Nov;139(3):1483-94. doi: 10.1104/pp.105.069963. Epub 2005 Oct 21. Plant Physiol. 2005. PMID: 16244139 Free PMC article.
-
Differential regulation of small heat-shock genes in plants: analysis of a water-stress-inducible and developmentally activated sunflower promoter.Plant Mol Biol. 1996 Jul;31(4):863-76. doi: 10.1007/BF00019473. Plant Mol Biol. 1996. PMID: 8806416
-
Transcriptional activation of a heat shock gene promoter in sunflower embryos: synergism between ABI3 and heat shock factors.Plant J. 1999 Dec;20(5):601-10. doi: 10.1046/j.1365-313x.1999.00635.x. Plant J. 1999. PMID: 10652132
-
Arabidopsis and the heat stress transcription factor world: how many heat stress transcription factors do we need?Cell Stress Chaperones. 2001 Jul;6(3):177-89. doi: 10.1379/1466-1268(2001)006<0177:aathst>2.0.co;2. Cell Stress Chaperones. 2001. PMID: 11599559 Free PMC article. Review.
-
Heat stress response in plants: a complex game with chaperones and more than twenty heat stress transcription factors.J Biosci. 2004 Dec;29(4):471-87. doi: 10.1007/BF02712120. J Biosci. 2004. PMID: 15625403 Review.
Cited by
-
Isolation of the Chinese rose sHSP gene promoter and its differential regulation analysis in transgenic Arabidopsis plants.Mol Biol Rep. 2012 Feb;39(2):1145-51. doi: 10.1007/s11033-011-0843-x. Epub 2011 May 15. Mol Biol Rep. 2012. PMID: 21573789
-
Heat Stress Factors Expressed during Seed Maturation Differentially Regulate Seed Longevity and Seedling Greening.Plants (Basel). 2020 Mar 6;9(3):335. doi: 10.3390/plants9030335. Plants (Basel). 2020. PMID: 32155706 Free PMC article.
-
A heat-inducible transcription factor, HsfA2, is required for extension of acquired thermotolerance in Arabidopsis.Plant Physiol. 2007 Jan;143(1):251-62. doi: 10.1104/pp.106.091322. Epub 2006 Nov 3. Plant Physiol. 2007. PMID: 17085506 Free PMC article.
-
TaHsfA6f is a transcriptional activator that regulates a suite of heat stress protection genes in wheat (Triticum aestivum L.) including previously unknown Hsf targets.J Exp Bot. 2015 Feb;66(3):1025-39. doi: 10.1093/jxb/eru462. Epub 2014 Nov 26. J Exp Bot. 2015. PMID: 25428996 Free PMC article.
-
A 9 bp cis-element in the promoters of class I small heat shock protein genes on chromosome 3 in rice mediates L-azetidine-2-carboxylic acid and heat shock responses.J Exp Bot. 2010 Oct;61(15):4249-61. doi: 10.1093/jxb/erq230. Epub 2010 Jul 19. J Exp Bot. 2010. PMID: 20643810 Free PMC article.
References
-
- Almoguera C, Prieto-Dapena P, Jordano J. Dual regulation of a heat shock promoter during embryogenesis: stage-dependent role of heat shock elements. Plant J. 1998;13:437–446. - PubMed
-
- Bharti K, Schmidt E, Lyck R, Heerklotz D, Bublak D, Scharf KD. Isolation and characterization of HsfA3, a new heat stress transcription factor of Lycopersicon peruvianum. Plant J. 2000;22:355–365. - PubMed
-
- Boscheinen O, Lyck R, Queitsch C, Treuter E, Zimarino V, Scharf KD. Heat stress transcription factors from tomato can functionally replace Hsf1 in the yeast Saccharomyces cerevisiae. Mol Gen Genet. 1997;255:322–331. - PubMed
Publication types
MeSH terms
Substances
LinkOut - more resources
Full Text Sources
Other Literature Sources
Molecular Biology Databases
Miscellaneous
