. 2002 Jul;129(3):1296-307.
doi: 10.1104/pp.001941.

The effects of abiotic factors on induced volatile emissions in corn plants

Affiliations

The effects of abiotic factors on induced volatile emissions in corn plants

Sandrine P Gouinguené et al. Plant Physiol. 2002 Jul.

Abstract

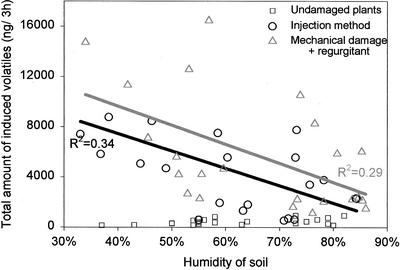
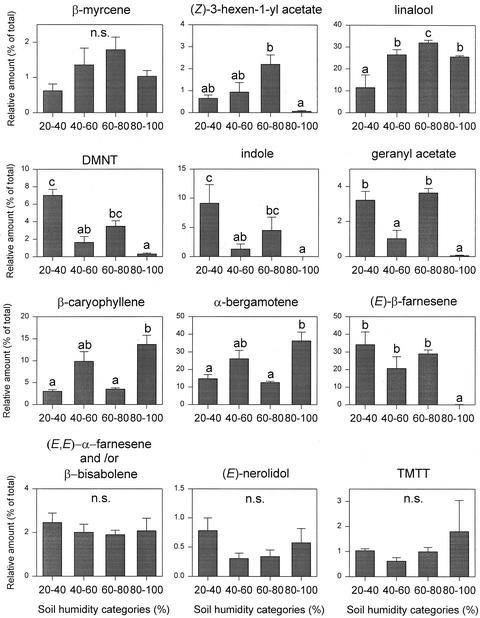
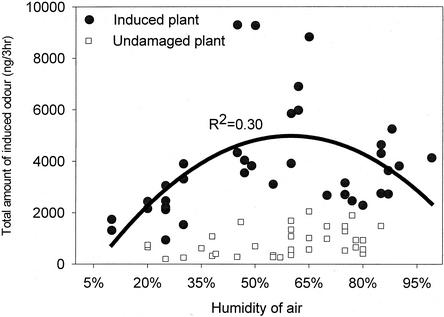
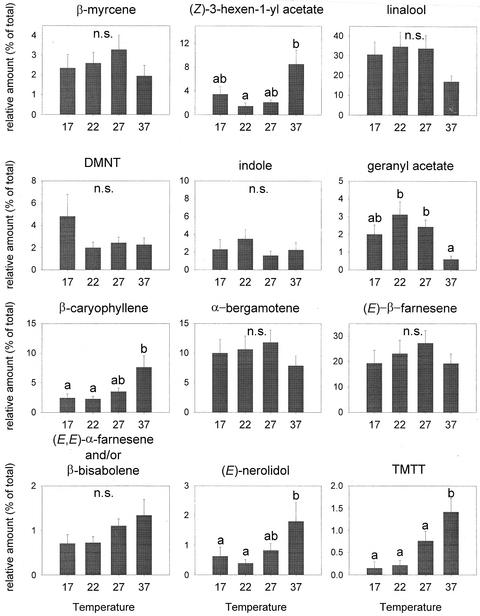
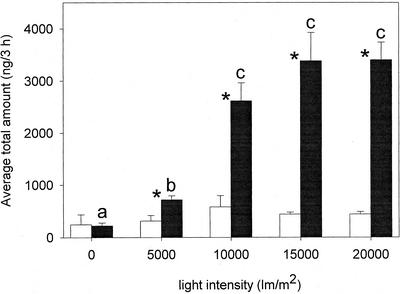
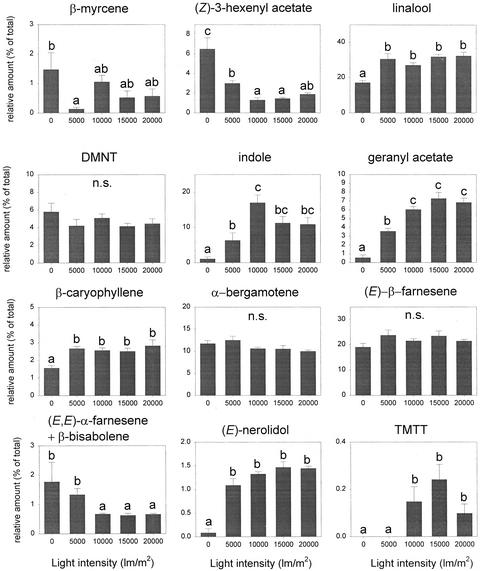
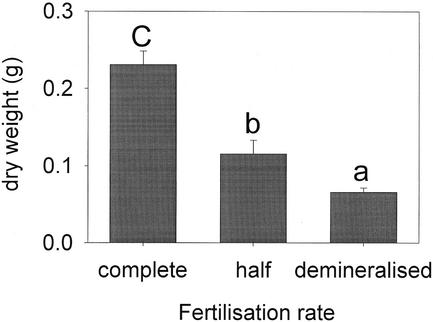
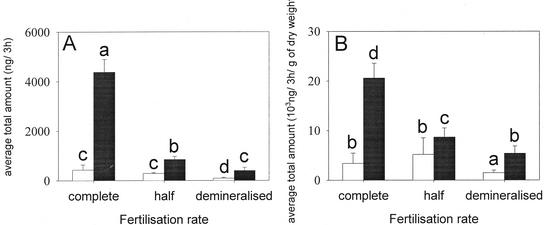
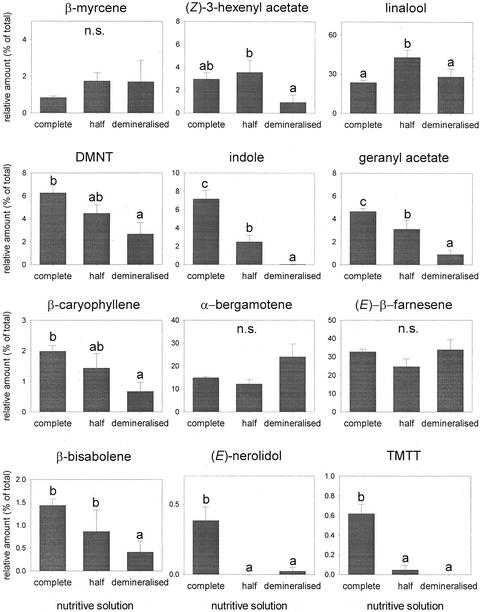
Many plants respond to herbivory by releasing a specific blend of volatiles that is attractive to natural enemies of the herbivores. In corn (Zea mays), this induced odor blend is mainly composed of terpenoids and indole. The induced signal varies with plant species and genotype, but little is known about the variation due to abiotic factors. Here, we tested the effect of soil humidity, air humidity, temperature, light, and fertilization rate on the emission of induced volatiles in young corn plants. Each factor was tested separately under constant conditions for the other factors. Plants released more when standing in dry soil than in wet soil, whereas for air humidity, the optimal release was found at around 60% relative humidity. Temperatures between 22 degrees C and 27 degrees C led to a higher emission than lower or higher temperatures. Light intensity had a dramatic effect. The emission of volatiles did not occur in the dark and increased steadily with an increase in the light intensity. An experiment with an unnatural light-dark cycle showed that the release was fully photophase dependent. Fertilization also had a strong positive effect; the emission of volatiles was minimal when plants were grown under low nutrition, even when results were corrected for plant biomass. Changes in all abiotic factors caused small but significant changes in the relative ratios among the different compounds (quality) in the induced odor blends, except for air humidity. Hence, climatic conditions and nutrient availability can be important factors in determining the intensity and variability in the release of induced plant volatiles.


Figures

Figure 1
Figure 1
Total amount (ng/3 h) of induced volatiles emitted by corn plants submitted to different levels of soil humidity. Triangles represent the amount of volatiles released after induction by mechanical damage + regurgitant on the wounded site, circles represent the amount of volatiles emitted after injection of regurgitant directly into the stem, and squares represent the odor emitted by healthy undamaged plants. Light-gray line represents the linear regression for mechanical damage + regurgitant-treated plants (F = 8.577 and P = 0.008) and dark line represents the linear regression for injection method-treated plants (F = 8.667 and P = 0.0091).
Figure 2
Figure 2
Relative amount (mean of % of total + se) of the 12 dominant compounds in the odor blend induced after mechanical damage and regurgitant application at different soil humidities. Humidity was divided in four categories of 20% intervals. Letters above bars indicate significant differences among soil humidity categories after Student-Newman-Keuls post hoc test (α = 0.05).
Figure 3
Figure 3
Total amount (ng/3 h) of induced volatiles emitted by corn plants under different air humidities. Circles represent the amount released by induced corn plants and squares represent the odor released by undamaged plants. Black curve represents the relation between the amount emitted by induced plants and the air humidity (F = 7.09 and P = 0.0027).
Figure 4
Figure 4
Total amount (mean + se) of odor emitted by corn plants under different temperatures (°C). Black bars represent induced plants and white bars represent undamaged plants. Stars indicate significant differences between induced plants and undamaged plants (F = 35.148 and P < 0.001) and letters above black bars indicate significant differences among the different temperature tested for induced plants by Student-Newman-Keuls post hoc test (α = 0.05).
Figure 5
Figure 5
Relative amount (mean of % of total + se) of the 12 dominant compounds in the induced odor blend at different temperatures. Letters above bars indicate significant differences among temperatures after Student-Newman-Keuls post hoc test (α = 0.05).
Figure 6
Figure 6
Total amount (mean + se) of volatiles emitted by corn plants under different light intensities. Black bars represent induced corn plants, and white bars represent undamaged plants. Stars indicate significant differences between the total amount of odor released by induced and undamaged plants (α = 0.05), and letters indicate significant differences after Student-Newman-Keuls post hoc test among light intensity for induced plants (α = 0.05).
Figure 7
Figure 7
Relative amount (mean of % of total + se) of the 12 dominant compounds in the induced odor blend at different light intensities. Letters above bars indicate significant differences among light intensities after Student-Newman-Keuls post hoc test (α = 0.05).
Figure 8
Figure 8
Total amount (mean + se) of volatiles emitted by corn plants under dark-light phases. Black bars represent induced corn plants, and white bars represent undamaged plants. The horizontal bar represents the respective dark and light phases.
Figure 9
Figure 9
Dry weight (mean + se) of corn plants grown under three different fertilization rates (F = 40.707 and P < 0.001). Letters above bars indicate significant differences among the different fertilization treatments after Student-Newman-Keuls post hoc test (α = 0.05).
Figure 10
Figure 10
Total amount (mean + se) of volatiles emitted by corn plants under three different fertilization rates (see text for details). The graph in A represents the amount without correction for biomass and the graph in B represents the amount corrected for biomass. Black bars represent induced plants, and white bars represent undamaged plants. Letters above bars indicate significant difference among fertilization rates after Student-Newman-Keuls post hoc test (α = 0.05). The fertilization rate also had an effect on the overall odor blend composed of the 12 dominant compounds (F = 2.689 and P = 0.001).
Figure 11
Figure 11
Relative amount (mean of % of total + se) of the 12 dominant compounds in the induced odor blend for plants at different fertilization levels. Letters above bars indicate significant differences among fertilization rates after Student-Newman-Keuls post hoc test (α = 0.05).

Similar articles

Cited by

References

    1. Agelopoulos NG, Keller MA. Plant-natural enemy association in tritrophic system, Cotesia rubecula-Pieris rapae-Brassicaceae (Cruciferae): III. Collection and identification of plant and grass volatiles. J Chem Ecol. 1994;20:1955–1967. - PubMed
    1. Alborn HT, Turlings TCJ, Jones TH, Stenhagen G, Loughrin JH, Tumlinson JH. An elicitor of plant volatiles from beet armyworm oral secretion. Science. 1997;276:945–949.
    1. Altenburger R, Matile P. Further observation on rhythmic emission of fragrance in flowers. Planta. 1990;180:194–197. - PubMed
    1. De Moraes CM, Lewis WJ, Paré PW, Alborn HT, Tumlinson JH. Herbivore-infested plants selectively attract parasitoids. Nature. 1998;393:570–573.
    1. Dicke M. Why do plants “ talk” ? Chemoecology. 1994;5/6,3/4:159–165.

Publication types

LinkOut - more resources