Proteome analysis of grain filling and seed maturation in barley
- PMID: 12114584
- PMCID: PMC166524
- DOI: 10.1104/pp.003681
Proteome analysis of grain filling and seed maturation in barley
Abstract
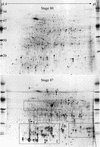
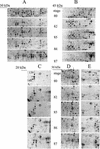
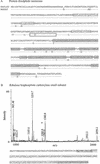
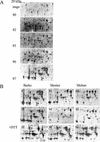
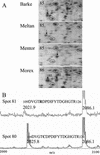
In monocotyledonous plants, the process of seed development involves the deposition of reserves in the starchy endosperm and development of the embryo and aleurone layer. The final stages of seed development are accompanied by an increase in desiccation tolerance and drying out of the mature seed. We have used two-dimensional gel electrophoresis for a time-resolved study of the changes in proteins that occur during seed development in barley (Hordeum vulgare). About 1,000 low-salt extractable protein spots could be resolved on the two-dimensional gels. Protein spots were divided into six categories according to the timing of appearance or disappearance during the 5-week period of comparison. Nineteen different proteins or protein fragments in 36 selected spots were identified by matrix-assisted laser-desorption ionization time of flight mass spectrometry (MS) or nano-electrospray tandem MS/MS. Some proteins were present throughout development (for example, cytosolic malate dehydrogenase), whereas others were associated with the early grain filling (ascorbate peroxidase) or desiccation (Cor14b) stages. Most noticeably, the development process is characterized by an accumulation of low-M(r) alpha-amylase/trypsin inhibitors, serine protease inhibitors, and enzymes involved in protection against oxidative stress. We present examples of proteins not previously experimentally observed, differential extractability of thiol-bound proteins, and possible allele-specific spot variation. Our results both confirm and expand on knowledge gained from previous analyses of individual proteins involved in grain filling and maturation.
Figures
Similar articles
-
Proteome analysis of barley seeds: Identification of major proteins from two-dimensional gels (pI 4-7).Proteomics. 2004 Aug;4(8):2437-47. doi: 10.1002/pmic.200300753. Proteomics. 2004. PMID: 15274138
-
Identification, cloning and characterization of two thioredoxin h isoforms, HvTrxh1 and HvTrxh2, from the barley seed proteome.Eur J Biochem. 2003 Jun;270(12):2633-43. doi: 10.1046/j.1432-1033.2003.03637.x. Eur J Biochem. 2003. PMID: 12787030
-
Spatio-temporal changes in germination and radical elongation of barley seeds tracked by proteome analysis of dissected embryo, aleurone layer, and endosperm tissues.Proteomics. 2007 Dec;7(24):4528-40. doi: 10.1002/pmic.200700766. Proteomics. 2007. PMID: 18022942
-
Proteomes of the barley aleurone layer: A model system for plant signalling and protein secretion.Proteomics. 2011 May;11(9):1595-605. doi: 10.1002/pmic.201000656. Epub 2011 Mar 23. Proteomics. 2011. PMID: 21433287 Review.
-
Barley seed proteomics from spots to structures.J Proteomics. 2009 Apr 13;72(3):315-24. doi: 10.1016/j.jprot.2008.12.001. Epub 2008 Dec 14. J Proteomics. 2009. PMID: 19118654 Review.
Cited by
-
Protein fragment domains identified using 2D gel electrophoresis/MALDI-TOF.J Biomol Tech. 2006 Apr;17(2):145-56. J Biomol Tech. 2006. PMID: 16741242 Free PMC article.
-
A Quantitative Proteomics View on the Function of Qfhb1, a Major QTL for Fusarium Head Blight Resistance in Wheat.Pathogens. 2018 Jun 22;7(3):58. doi: 10.3390/pathogens7030058. Pathogens. 2018. PMID: 29932155 Free PMC article.
-
Proteomic Analysis of Tung Tree (Vernicia fordii) Oilseeds during the Developmental Stages.Molecules. 2016 Nov 8;21(11):1486. doi: 10.3390/molecules21111486. Molecules. 2016. PMID: 27834836 Free PMC article.
-
Is Gluten the Only Culprit for Non-Celiac Gluten/Wheat Sensitivity?Nutrients. 2020 Dec 10;12(12):3785. doi: 10.3390/nu12123785. Nutrients. 2020. PMID: 33321805 Free PMC article. Review.
-
Comparative proteome analysis of embryo and endosperm reveals central differential expression proteins involved in wheat seed germination.BMC Plant Biol. 2015 Apr 8;15:97. doi: 10.1186/s12870-015-0471-z. BMC Plant Biol. 2015. PMID: 25888100 Free PMC article.
References
-
- Asada K. Ascorbate peroxidase: a hydrogen peroxidase scavenging system in plants. Physiol Plant. 1992;85:235–241.
-
- Bewley JD, Black M. Physiology and Biochemistry of Seeds. Berlin: Springer-Verlag; 1978.
-
- Bradford MM. A rapid and sensitive method for the quantitation of microgram quantities of protein using the principle of protein-dye binding. Anal Biochem. 1976;72:248–254. - PubMed
-
- Brandt A, Svendsen I, Hejgaard J. A plant serpin gene. Structure, organization and expression of the gene encoding barley protein Z4. Eur J Biochem. 1990;194:499–505. - PubMed
Publication types
MeSH terms
Substances
LinkOut - more resources
Full Text Sources

