. 2002 Jul;129(3):1368-81.
doi: 10.1104/pp.001925.

Cold-regulated cereal chloroplast late embryogenesis abundant-like proteins. Molecular characterization and functional analyses

Affiliations

Cold-regulated cereal chloroplast late embryogenesis abundant-like proteins. Molecular characterization and functional analyses

Christian NDong et al. Plant Physiol. 2002 Jul.

Abstract

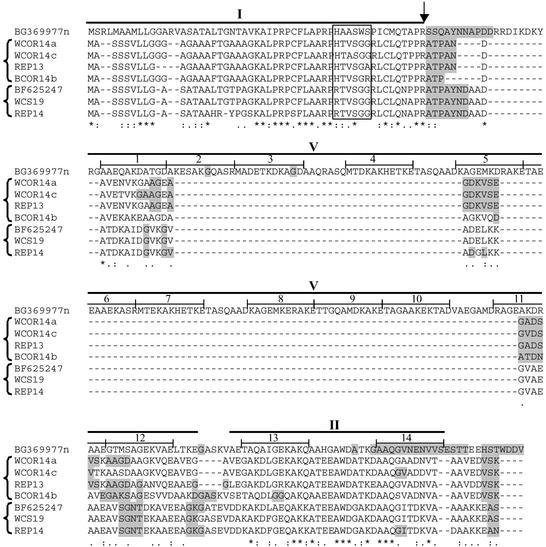
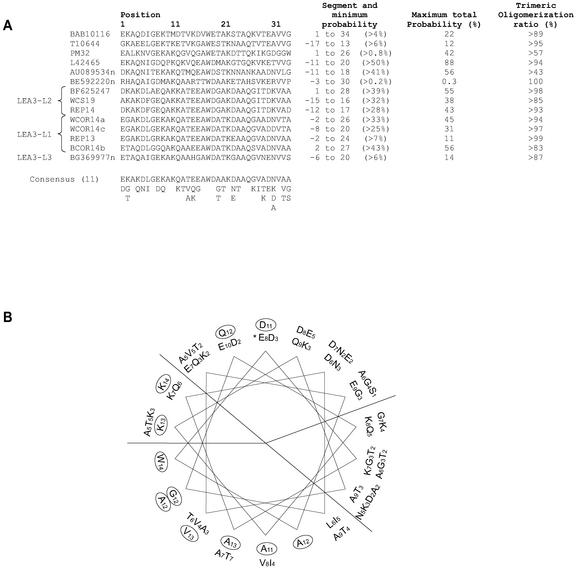
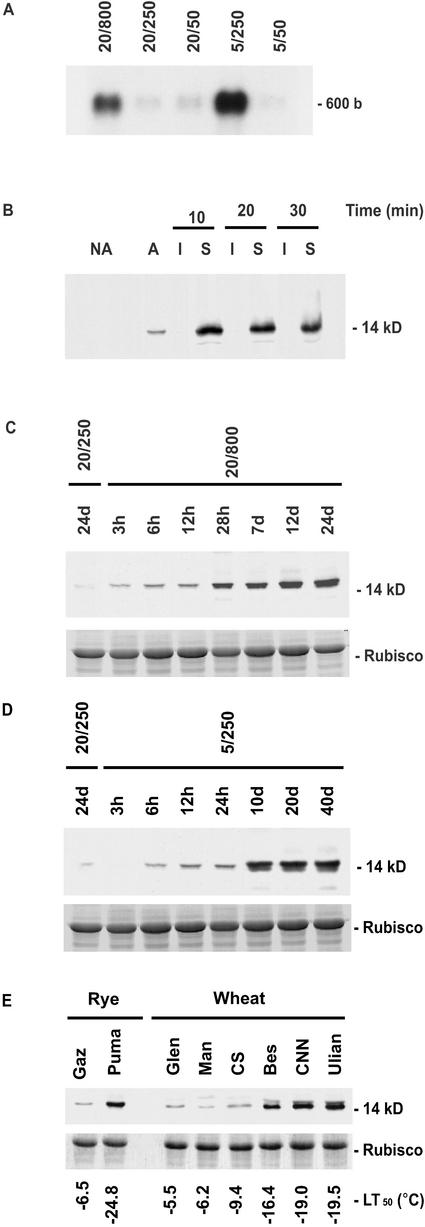
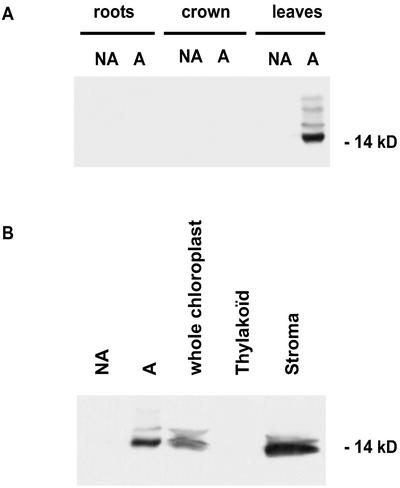
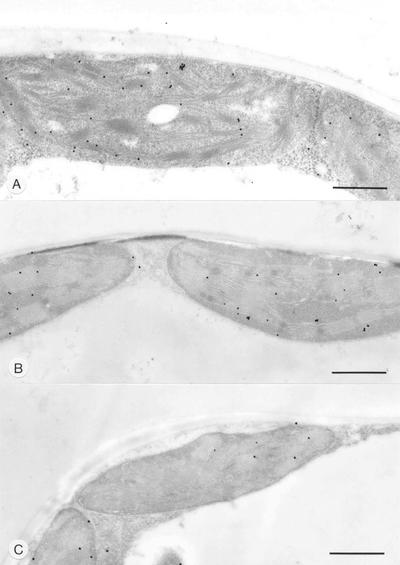
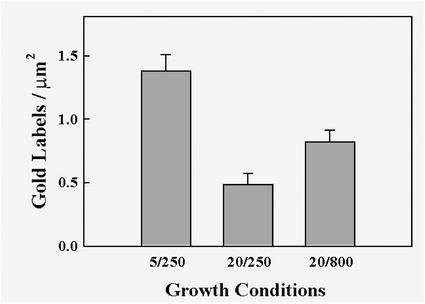
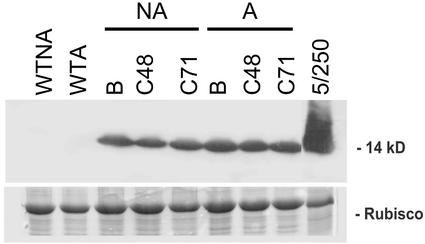
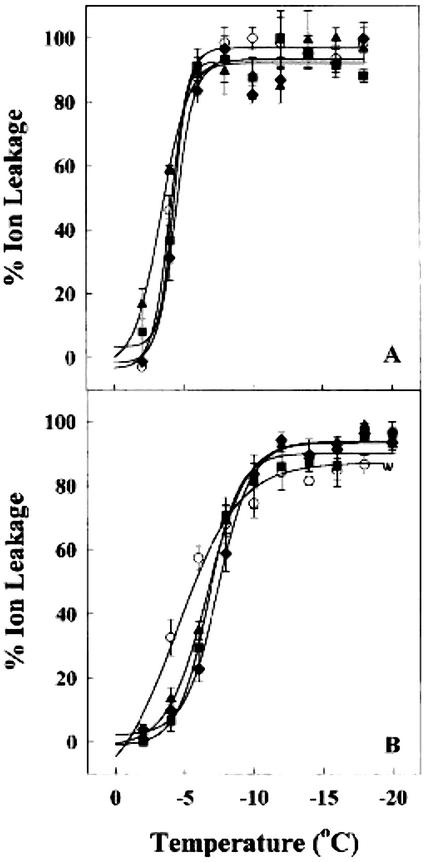
Cold acclimation and freezing tolerance are the result of complex interaction between low temperature, light, and photosystem II (PSII) excitation pressure. Previous results have shown that expression of the Wcs19 gene is correlated with PSII excitation pressure measured in vivo as the relative reduction state of PSII. Using cDNA library screening and data mining, we have identified three different groups of proteins, late embryogenesis abundant (LEA) 3-L1, LEA3-L2, and LEA3-L3, sharing identities with WCS19. These groups represent a new class of proteins in cereals related to group 3 LEA proteins. They share important characteristics such as a sorting signal that is predicted to target them to either the chloroplast or mitochondria and a C-terminal sequence that may be involved in oligomerization. The results of subcellular fractionation, immunolocalization by electron microscopy and the analyses of target sequences within the Wcs19 gene are consistent with the localization of WCS19 within the chloroplast stroma of wheat (Triticum aestivum) and rye (Secale cereale). Western analysis showed that the accumulation of chloroplastic LEA3-L2 proteins is correlated with the capacity of different wheat and rye cultivars to develop freezing tolerance. Arabidopsis was transformed with the Wcs19 gene and the transgenic plants showed a significant increase in their freezing tolerance. This increase was only evident in cold-acclimated plants. The putative function of this protein in the enhancement of freezing tolerance is discussed.


Figures

Figure 1
Figure 1
Alignment of three groups of proteins from wheat, rye, and barley sharing identities with WCS19. ClustalW alignment of wheat WCS19 (accession no. L13437), rye REP14 (accession no. AF491840), barley BF625247 (deduced from cv Morex; EST accession no. BF625247), wheat WCOR14a (accession nos. AF207545 and AF491838) and WCOR14c (accession no. AF491837), rye REP13 (accession no. AF491839), and barley BCOR14b (accession no. M60732) and BG369977n. ESTs from barley cv Morex, BG369977, BG369422, BE454426, and BE196464 were used to generate the sequence BG369977n of 999 bases. The sequence contained an open reading frame with three possible start codons and one stop codon encoding a protein of 293 amino acids. Residues within motifs resembling the consensus 11-mer repeat characteristic of group 3 LEA proteins are shown and numbered above the BG369977n protein. { distinguishes the groups of proteins. I, The conserved region coding for the putative signal peptide; II, the conserved C-terminal region; V, the variable region. The arrow indicates the putative cleavage site of the signal peptide determined with ChloroP. The boxed amino acids in region I highlight a sequence resembling the 14-3-3 recognition motif. Shaded amino acids in the largely α-helical mature proteins represent regions predicted to adopt a coil conformation by PELE, a program that uses eight different algorithms to study secondary structure. −, Gaps introduced to maximize alignment; *, identical residues; :, highly conserved residues; ., conserved residues.
Figure 2
Figure 2
Alignment and structure analysis of the conserved C-terminal region from different plants. A, ClustalW alignment and Multicoil analysis of the conserved C-terminal region (II) of proteins from the LEA3-L1, -L2, and -L3 groups with six proteins from other plants sharing a homology in this region. Arabidopsis proteins of 331 amino acids (BAB10116) and 266 amino acids (T10644) were deduced from genomic sequencing. PM32 (AF166485) is a 173-amino acid maturation protein identified in soybean (Glycine max; Chow et al., 1999). L42465 is a 190-amino acid LEA protein identified in Picea glauca (Dong and Dunstan, 1996). AU089534n is a 165-amino acid protein from Lotus japonicus that was reconstituted from three ESTs: AU089534, AU089020, and AU089581. BE592220n is an incomplete protein (102 amino acids) from sorghum (Sorghum bicolor) reconstituted from ESTs BE592220 and BE592752. The consensus sequence represents the compilation of amino acids conserved in at least 11 out 14 proteins. To the right of the alignment is a summary of the probabilities for the C-terminal region of the 14 proteins to form a coiled coil motif. The results were obtained using Multicoil scores based upon pair wise interactions for residues at distances 2, 3, and 4 apart with the dimeric table and at distances 3, 4 and 5 apart with the trimeric table (Wolf et al., 1997). Segment and minimum probability (%), High scoring segments with minimum 25 residues are defined by numbering relative to the first residue in the C-terminal region alignment. In this segment, the lowest total probability for a residue or subsegment to form a coiled coil motif is given as a percentage. Maximum total probability, The maximum probability for a residue or subsegment in the previously defined 25 residues segment. Trimeric oligomerization ratio, The trimeric score divided by the total score in the C-terminal region. To analyze L42465 from P. glauca, the Pro (a helix breaker) at position 10 was changed to Ala the most common amino acid at that position. B, Helical wheel projection of the consensus sequence generated from region II of the 14 proteins. Amino acids and the number of times they were repeated in at least 11 proteins are indicated for each position. Circled positions indicate single residues conserved in at least 11 proteins. *, Position 1 in Figure 2A.
Figure 3
Figure 3
Expression analysis and accumulation of LEA3-L2 proteins in rye and wheat. A, Transcript accumulation of rye LEA3-L2 gene using Rep14 as probe. Equal amounts of total RNA (5 μg) were separated by agarose gel electrophoresis in the presence of formaldehyde and transferred to a nitrocellulose membrane. 20/800, 20/250, and 20/50 represent rye plants grown at 20°C and at 800 μmol m−2 s−1, 250 μmol m−2 s−1, or 50 μmol m−2 s−1, respectively. 5/250 and 5/50 represent rye plants grown at 5°C and at 250 μmol m−2 s−1 or 50 μmol m−2 s−1, respectively. The size of Rep14 transcript is indicated on the right in bases. B, Boiling solubility of LEA3-L2 proteins. NA and A, Soluble proteins (5 μg) from leaves of rye plants (cv Musketeer) grown at 20/250 (24 d) and 5/250 (40 d), respectively. In addition, soluble proteins from 5/250 leaves were heated at 100°C for the time indicated. Insoluble (I) and boiling soluble (S) fractions were analyzed by immunoblotting as described in “Materials and Methods.” The size of the mature REP14 in kilodaltons is indicated at right. C, Accumulation kinetics of the rye LEA3-L2 protein during high-light exposure. Rye plants grown at 20/250 for 24 d were shifted to 20/800 conditions for the number of hours (h) and days (d) indicated. Soluble proteins (5 μg) were analyzed by immunoblotting. To show uniform loading, the Coomassie Blue-stained Rubisco subunit (55 kD) is shown. D, Accumulation kinetics of the rye LEA3-L2 protein during low-temperature acclimation. Plants grown at 20/250 for 24 d were shifted to 5/250 conditions for the time indicated, and soluble proteins (5 μg) were analyzed by immunoblotting. E, Accumulation of LEA3-L2 proteins in different wheat and rye cultivars cold acclimated for 49 d. Immunoblot analysis was done with soluble proteins (5 μg) from leaf tissues of spring rye and wheat cv Gazelle (Gaz), Glenlea (Glen), Manitou (Man), and Chinese Spring (CS) and from winter rye and wheat cv Puma (Puma), Besostoya (Bes), Cheyenne (CNN), and Ulian (Ulian).
Figure 4
Figure 4
Wheat LEA3-L2 (WCS19) tissue distribution and subcellular localization. A, Immunoblot analysis of soluble leaf proteins (5 μg) present in different tissues of wheat (cv Fredrick) grown under low-temperature conditions. NA, Nonacclimated plants; A, plants cold acclimated for 2 weeks. B, Immunoblot analysis of proteins (5 μg) present in different chloroplast compartments. Legend as in A.
Figure 5
Figure 5
Electron microscopy of rye leaf sections incubated with anti-WCS19 antibody. A, Plants grown at low temperature for 40 d (5/250). B, Plants grown at high light for 14 d (20/800). C, Nonacclimated plants grown at 20/250 for 24 d. The magnification of each image is 22,000×. The images shown are representative of typical WCS19 labeled chloroplasts from plants grown under the given conditions.
Figure 6
Figure 6
Density of the immunogold labeling obtained with the anti-WCS19 antibody in chloroplasts of rye plants exposed to three growth conditions. The number of gold particles per square micrometer of the chloroplasts was determined using the Northern Eclipse Image Analysis software package. This allowed the analysis of digitized images of representative chloroplasts from WCS19 labeled sections of rye leaves grown under the indicated conditions. Bars represent mean ± se, n = 10.
Figure 7
Figure 7
Accumulation of the wheat LEA3-L2 (WCS19) protein in transgenic Arabidopsis grown at 20°C/100 μmol m−2 s−1. Soluble proteins (5 μg) from rye leaves (5/250) were used as positive control. The immunoblot was overexposed to show that the anti-WCS19 antibody does not recognize any endogenous proteins in wild-type (WT) Arabidopsis plants. B, C48, and C71 represent the transgenic lines. NA, Nonacclimated; A, plants cold acclimated for 1 week.
Figure 8
Figure 8
Effect of the constitutive expression of wheat LEA3-L2 (WCS19) on the freezing tolerance of Arabidopsis leaves. A, Electrolyte leakage curves from leaves of plants grown at 20°C. B, Electrolyte leakage curves from leaves of plants shifted from 20°C to 5°C for 1 week. Wild-type (○) and transgenic lines B, C48, and C71 (▴, ▪, and ♦, respectively). From the electrolyte leakage curves, the LT50 was determined as the temperature at which 50% of the ions leaked out the leaf and used as an estimate of freezing tolerance. The experiments were done four times (n = 3 leaves for each temperature) for each transgenic lines and values represent mean ± se.
Figure 9
Figure 9
The effect of constitutive expression of the wheat LEA3-L2 (WCS19) protein on photoinhibition of Arabidopsis leaves. A, Photoinhibition of detached leaves from plants grown at (20°C). B, Photoinhibition of detached leaves from plants shifted from 20°C to 5°C for 1 week. Symbols as in Figure 8. The experiments were done four times (n = 3 leaves for each time) for each transgenic lines and values represent mean ± se. Where not visible, the error bars are smaller than the symbols.

Similar articles

Cited by

References

    1. Akashi K, Grandjean O, Small I. Potential dual targeting of an Arabidopsisarchaebacterial-like histidyl-tRNA synthetase to mitochondria and chloroplast. FEBS Lett. 1998;431:39–44. - PubMed
    1. Altschul SF, Madden TL, Schäffer AA, Zhang J, Zhang Z, Miller W, Lipman D. Gapped BLAST and PSI-BLAST: a new generation of protein database search programs. Nucleic Acids Res. 1997;25:3389–3402. - PMC - PubMed
    1. Artus NN, Uemura M, Steponkus PL, Gilmour SJ, Lin CT, Tomashow MF. Constitutive expression of the cold-regulated Arabidopsis thaliana COR15agene affects both chloroplast and protoplast freezing tolerance. Proc Natl Acad Sci USA. 1996;93:13404–13409. - PMC - PubMed
    1. Asada K. Production and action of active oxygen species in photosynthesis tissues. In: Foyer CH, Mullineaux PM, editors. Causes of Photooxidative Stress and Amelioration of Defense Systems in Plants. FL: CRC Press Boca Raton; 1994. pp. 77–104.
    1. Berger B, Wilson DB, Wolf E, Tonchev T, Milla M, Kim P. Predicting coiled coils by use of pairwise residue correlations. Proc Natl Acad Sci USA. 1995;92:8259–8263. - PMC - PubMed

Publication types

MeSH terms

Substances

Associated data

LinkOut - more resources