. 2002 Aug;70(8):4501-9.
doi: 10.1128/IAI.70.8.4501-4509.2002.

Dissemination of Mycobacterium tuberculosis is influenced by host factors and precedes the initiation of T-cell immunity

Affiliations

Dissemination of Mycobacterium tuberculosis is influenced by host factors and precedes the initiation of T-cell immunity

Alissa A Chackerian et al. Infect Immun. 2002 Aug.

Abstract

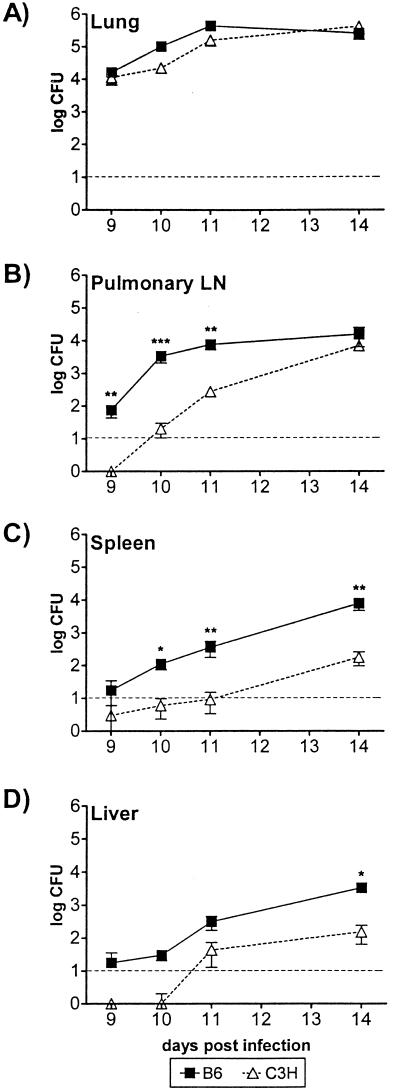
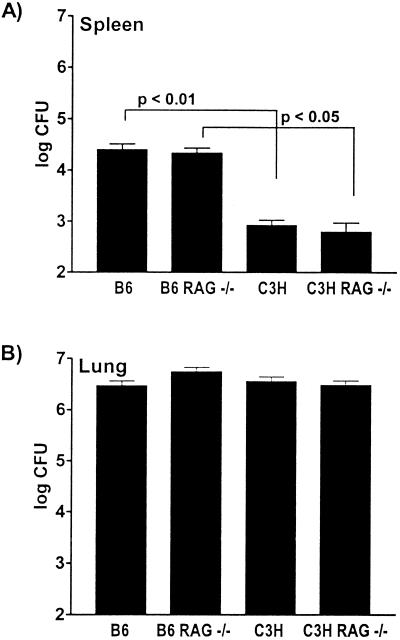
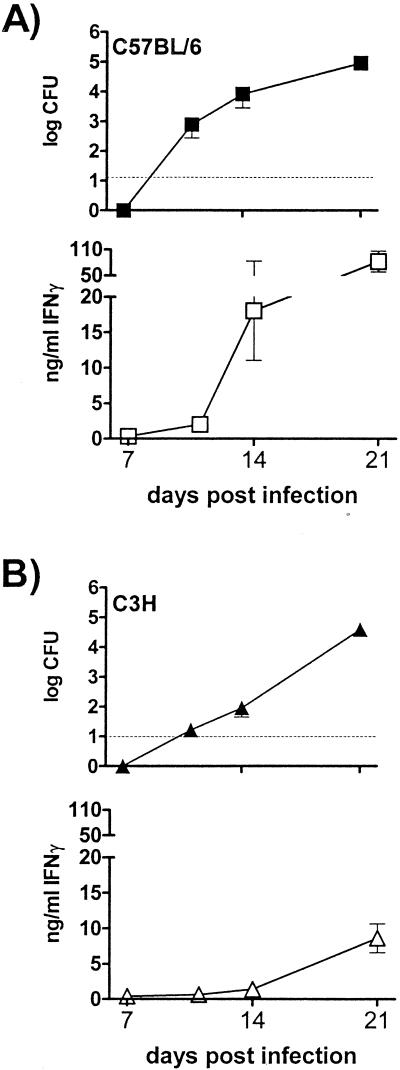
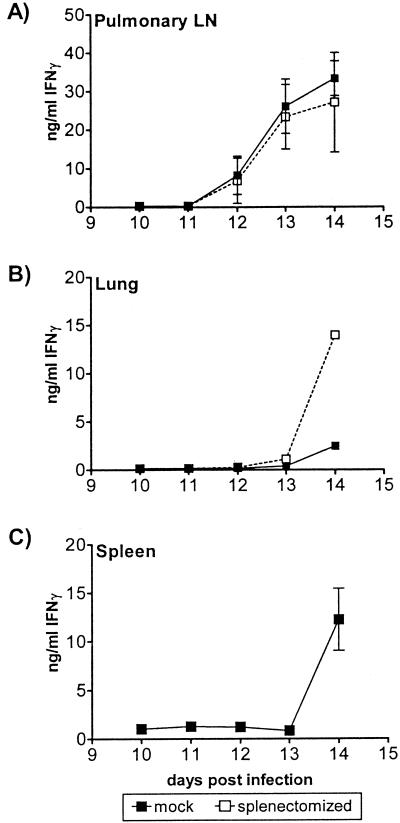
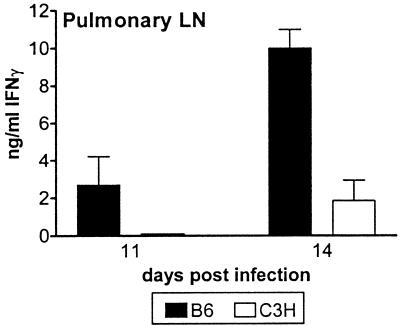
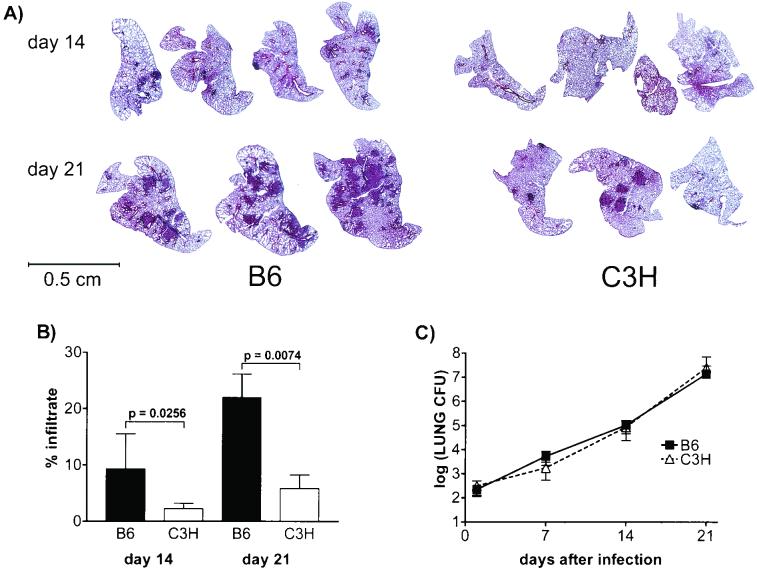
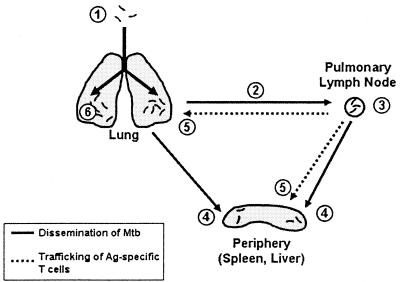
We report that dissemination of Mycobacterium tuberculosis in the mouse is under host control and precedes the initiation of T-cell immunity. Nine to eleven days after aerosol inoculation, M. tuberculosis disseminates to the pulmonary lymph nodes (LN), where M. tuberculosis-specific T cells are detected 2 to 3 days thereafter. This indicates that the initial spread of bacteria occurs via lymphatic drainage and that the acquired T-cell immune response is generated in the draining LN. Dissemination to peripheral sites, such as the spleen and the liver, occurs 11 to 14 days postinfection and is followed by the appearance of M. tuberculosis-specific T cells in the lung and the spleen. In all cases studied, dissemination to the LN or the spleen preceded activation of M. tuberculosis-specific T cells in that organ. Interestingly, bacteria disseminate earlier from the lungs of resistant C57BL/6 mice than from the lungs of susceptible C3H mice, and consequently, C57BL/6 mice generate an immune response to M. tuberculosis sooner than C3H mice generate an immune response. Thus, instead of spreading infection, early dissemination of M. tuberculosis may aid in the initiation of an appropriate and timely immune response. We hypothesize that this early initiation of immunity following inoculation with M. tuberculosis may contribute to the superior resistance of C57BL/6 mice.


Figures

FIG. 1.
FIG. 1.
Dissemination of M. tuberculosis following aerosol inoculation. B6 and C3H/HeJ mice were sacrificed at various times after infection, and the numbers of M. tuberculosis CFU in the lungs (A), PLN (B), spleens (C), and livers (D) were determined. The symbols indicate means, and the error bars indicate the standard deviations based on four to six mice per time point per group. The dashed line indicates the limit of detection of M. tuberculosis (10 CFU). A two-way ANOVA with Bonferroni post tests was used to test for statistically significant differences between the groups of mice, and the P values are indicated as follows: one asterisk, P < 0.05; two asterisks, P < 0.01; and three asterisks, P < 0.001. The data are representative of the data obtained in three to five separate experiments.
FIG. 2.
FIG. 2.
Dissemination is similar in RAG+/+ and RAG−/− mice. B6, B6 RAG−/−, C3H/HeN, and C3H/HeN RAG−/− mice were sacrificed at 14 days postinfection. The numbers of M. tuberculosis CFU in the spleens (A) and lungs (B) were determined. The bars and error bars indicate the means and standard deviations, respectively, based on six mice per group. The number of lung CFU did not vary significantly among the four different strains of mice. The number of splenic CFU did not differ significantly between the B6 and B6 RAG−/− mice or between the C3H/HeN and C3H/HeN RAG−/− mice. Significant differences were detected between B6 and C3H/HeN mice and between B6 RAG−/− and C3H/HeN RAG−/− mice, as indicated. All analyses were carried out by using the one-way ANOVA with the Tukey posttest for multiple comparisons. The data are representative of the data obtained in four experiments.
FIG. 3.
FIG. 3.
Dissemination of M. tuberculosis precedes development of an acquired immune response. Spleens were removed from B6 mice (A) and C3H/HeJ mice (B) at 11, 14, and 21 days after infection. One half of each spleen was used to determine the number of bacterial CFU (solid symbols), and the other half was used in in vitro restimulation assays to determine IFN-γ production in response to M. tuberculosis antigen (open symbols). The dashed line indicates the limit of CFU detection (10 CFU). The amounts of IFN-γ produced after 48 h of stimulation with a 1:5,000 dilution of M. tuberculosis sonicate are shown. The error bars indicate the standard deviations based on six mice per group.
FIG. 4.
FIG. 4.
Recall response to M. tuberculosis antigen by splenectomized or mock-splenectomized mice. At various times after infection, cell suspensions were prepared from the PLN (A), lungs (B), or spleens (C) of B6 mice which had been splenectomized or mock splenectomized prior to inoculation. The amounts of IFN-γ produced after 48 h of stimulation with a 1:5,000 dilution of M. tuberculosis sonicate are shown. The error bars indicate the standard deviations based on three to six mice per group. The spleens and LN were assayed individually. The lung mononuclear cells were pooled; thus, there are no error bars in panel B. The data are representative of the data obtained in two experiments.
FIG. 5.
FIG. 5.
An antigen-specific response can be detected earlier in B6 PLN than in C3H/HeJ PLN following infection with M. tuberculosis. PLN cells were prepared from B6 and C3H/HeJ mice 11 and 14 days postinfection and stimulated in vitro with M. tuberculosis antigen. The IFN-γ levels shown are the mean responses of cells to a 1:5,000 dilution of H37Ra sonicate, and the error bars indicate the standard deviations based on four mice per group. The groups of mice were compared to each other by using an unpaired t test, and P = 0.003 at day 14. The data are representative of the data obtained in two experiments.
FIG. 6.
FIG. 6.
Gross pathology of the lung and image analysis. (A) Lung sections from B6 and C3H/HeJ mice stained with hematoxylin and eosin. Three or four representative lung sections per time point are shown. (B) Percentages of infiltrated lung determined as described in Materials and Methods. Six mice were analyzed per strain per time point, and the data for the B6 and C3H/HeJ mouse strains were compared by using an unpaired t test. (C) M. tuberculosis CFU from the left lung of each mouse in panel A were quantitated. Two-way ANOVA with Bonferroni post tests did not reveal a statistically significant difference in the number of lung CFU between the two strains.
FIG. 7.
FIG. 7.
Model of extrapulmonary dissemination and initiation of T-cell immunity. Mtb, M. tuberculosis; Ag, antigen.

Similar articles

Cited by

References

    1. Abel, L., and J. L. Casanova. 2000. Genetic predisposition to clinical tuberculosis: bridging the gap between simple and complex inheritance. Am. J. Hum. Genet. 67:274-277. - PMC - PubMed
    1. Behar, S. M., T. A. Podrebarac, C. J. Roy, C. R.Wang, and M. B. Brenner. 1999. Diverse TCRs recognize murine CD1. J. Immunol. 162:161-167. - PubMed
    1. Behar, S. M., S. A. Porcelli, E. M. Beckman, and M. B. Brenner. 1995. A pathway of costimulation that prevents anergy in CD28- T cells: B7-independent costimulation of CD1-restricted T cells. J. Exp. Med. 182:2007-2018. - PMC - PubMed
    1. Belkaid, Y., S. Mendez, R. Lira, N. Kadambi, G. Milon, and D. Sacks. 2000. A natural model of Leishmania major infection reveals a prolonged “silent” phase of parasite amplification in the skin before the onset of lesion formation and immunity. J. Immunol. 165:969-977. - PubMed
    1. Bosio, C. M., D. Gardner, and K. L. Elkins. 2000. Infection of B cell-deficient mice with CDC 1551, a clinical isolate of Mycobacterium tuberculosis: delay in dissemination and development of lung pathology. J. Immunol. 164:6417-6425. - PubMed

Publication types

LinkOut - more resources