Comparative Study
. 2002 Jul;14(7):1441-56.
doi: 10.1105/tpc.010478.

Deductions about the number, organization, and evolution of genes in the tomato genome based on analysis of a large expressed sequence tag collection and selective genomic sequencing

Affiliations
Comparative Study

Deductions about the number, organization, and evolution of genes in the tomato genome based on analysis of a large expressed sequence tag collection and selective genomic sequencing

Rutger Van der Hoeven et al. Plant Cell. 2002 Jul.

Abstract

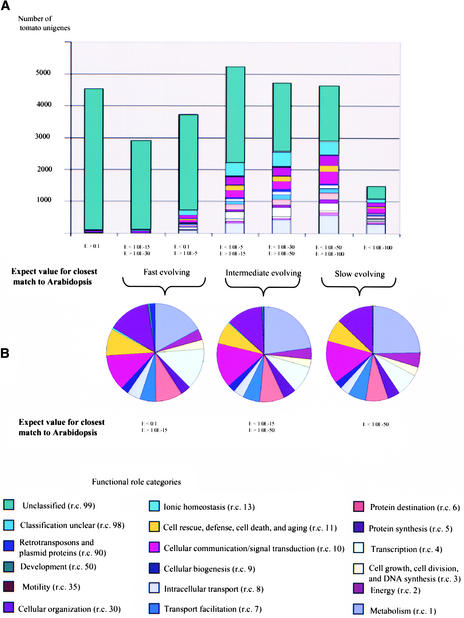
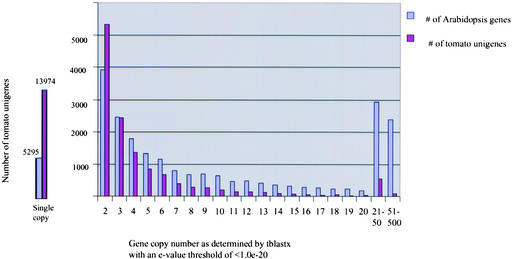
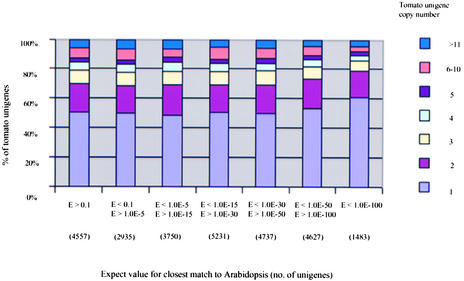
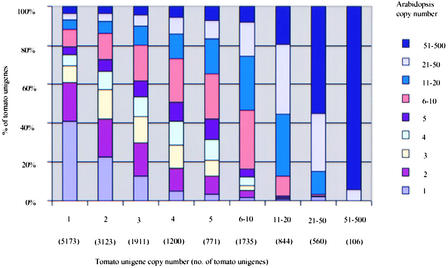
Analysis of a collection of 120,892 single-pass ESTs, derived from 26 different tomato cDNA libraries and reduced to a set of 27,274 unique consensus sequences (unigenes), revealed that 70% of the unigenes have identifiable homologs in the Arabidopsis genome. Genes corresponding to metabolism have remained most conserved between these two genomes, whereas genes encoding transcription factors are among the fastest evolving. The majority of the 10 largest conserved multigene families share similar copy numbers in tomato and Arabidopsis, suggesting that the multiplicity of these families may have occurred before the divergence of these two species. An exception to this multigene conservation was observed for the E8-like protein family, which is associated with fruit ripening and has higher copy number in tomato than in Arabidopsis. Finally, six BAC clones from different parts of the tomato genome were isolated, genetically mapped, sequenced, and annotated. The combined analysis of the EST database and these six sequenced BACs leads to the prediction that the tomato genome encodes approximately 35,000 genes, which are sequestered largely in euchromatic regions corresponding to less than one-quarter of the total DNA in the tomato nucleus.


Figures

Figure 1.
Figure 1.
Distribution of Sequence Length (bp) of Consensus Sequences (TCs) and Singletons That Constitute the Tomato Unigene Set.
Figure 2.
Figure 2.
Distribution of Tomato Unigenes Whose Putative Functions Could Be Assigned through Annotation. Role categories are according to the Munich Information Center for Protein Sequences (http://mips.gsf.de) and are as follows: metabolism (r.c. 1); energy (r.c. 2); cell growth, cell division, and DNA synthesis (r.c. 3); transcription (r.c. 4); protein synthesis (r.c. 5); protein destination (r.c. 6); transport facilitation (r.c. 7); intracellular transport (r.c. 8); cellular biogenesis (r.c. 9); cellular communication/signal transduction (r.c. 10); cell rescue, defense, death, and aging (r.c. 11); cellular organization (r.c. 30); and development (r.c. 50).
Figure 3.
Figure 3.
Distribution of Conservation between Tomato Unigenes and Genes in the Arabidopsis Genome Based on tBLASTX scores. (A) All tomato genes. (B) Only those tomato genes for which putative function could be established through annotation.
Figure 4.
Figure 4.
Distribution of Tomato Unigene Sequences That Are Conserved with M. truncatula (threshold of ≤1.0 E-20; tBLASTX) Plotted against the Conservation of These Genes with Arabidopsis Genes (as in Figure 3).
Figure 5.
Figure 5.
Comparison of Multigene Family Copy Numbers between Tomato and Arabidopsis.
Figure 6.
Figure 6.
Percentage of Tomato Unigenes Belonging to Single versus Multigene Families and Categorized on the Basis of the Level of Sequence Conservation between Each Tomato Gene Family and the Corresponding Arabidopsis Family Members as Measured by tBLASTX Scores (as in Figure 3).
Figure 7.
Figure 7.
Distribution of Copy Numbers of Tomato Gene Families and Comparison of Copy Numbers for Corresponding Gene Families in Arabidopsis. Both tomato and Arabidopsis genes were assigned to gene families based on tBLASTX scores with E-values of <1.00 E-20. Tomato and Arabidopsis gene family correspondence was based on the best tomato and Arabidopsis gene match for each family returning tBLASTX scores with E-values of <1.00 E-30.
Figure 8.
Figure 8.
Genetic Map Position of Each of the Six Sequenced BAC Clones. Genetic linkage map based on the work of Tanksley et al. (1992). At left of each linkage map is the corresponding pachytene chromosome. Open ovals indicate centromeres. Corresponding positions of centromeres on the genetic map are indicated by dashed lines. Dark knobs adjacent to centromeres represent the heterochromatin of each pachytene chromosome. The approximate position of each BAC clone in the corresponding pachytene chromosome is indicated by brackets and is based on previous deletion mapping of genetically mapped markers (Khush and Rick, 1968).

References

    1. Adam, D. (2000). Now for the hard ones. Nature 408, 792–793. - PubMed
    1. Arabidopsis Genome Initiative. (2000). Analysis of the genome sequence of the flowering plant Arabidopsis thaliana. Nature 408, 796–815. - PubMed
    1. Arumuganathan, K., and Earle, E.D. (1991). Nuclear DNA content of some important plant species. Plant Mol. Biol. Rep. 9, 208–219.
    1. Bernatzky, R., and Tanksley, S.D. (1986). Majority of random cDNA clones correspond to single loci in the tomato genome. Mol. Gen. Genet. 203, 8–14.
    1. Budiman, M.A., Mao, L., Wood, T.C., and Wing, R.A. (2000). A deep-coverage tomato BAC library and prospects toward development of an STC framework for genome sequencing. Genome Res. 10, 129–136. - PMC - PubMed

Publication types

MeSH terms