. 2002 Jul 23;99(15):9905-12.
doi: 10.1073/pnas.042694899. Epub 2002 Jul 15.

Punctuated evolution of mitochondrial gene content: high and variable rates of mitochondrial gene loss and transfer to the nucleus during angiosperm evolution

Affiliations

Punctuated evolution of mitochondrial gene content: high and variable rates of mitochondrial gene loss and transfer to the nucleus during angiosperm evolution

Keith L Adams et al. Proc Natl Acad Sci U S A. .

Abstract

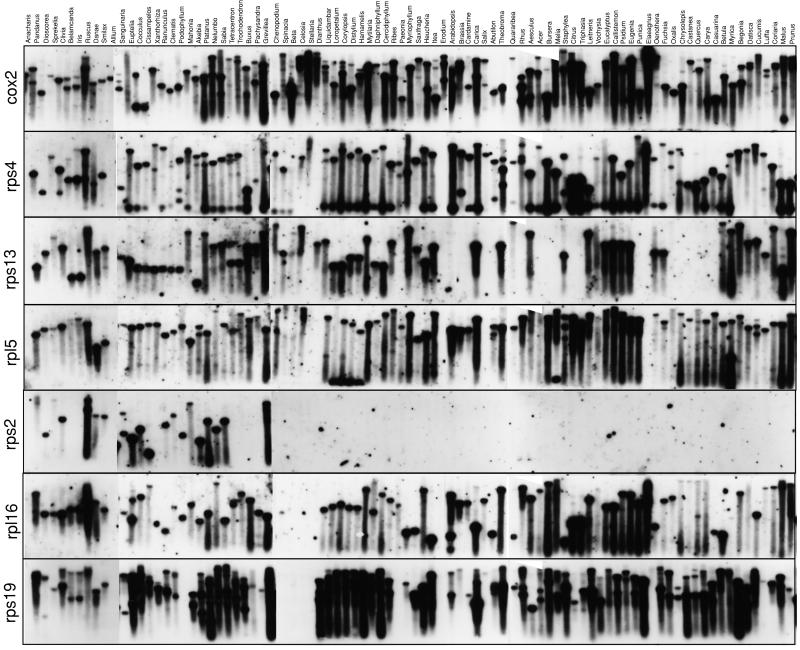
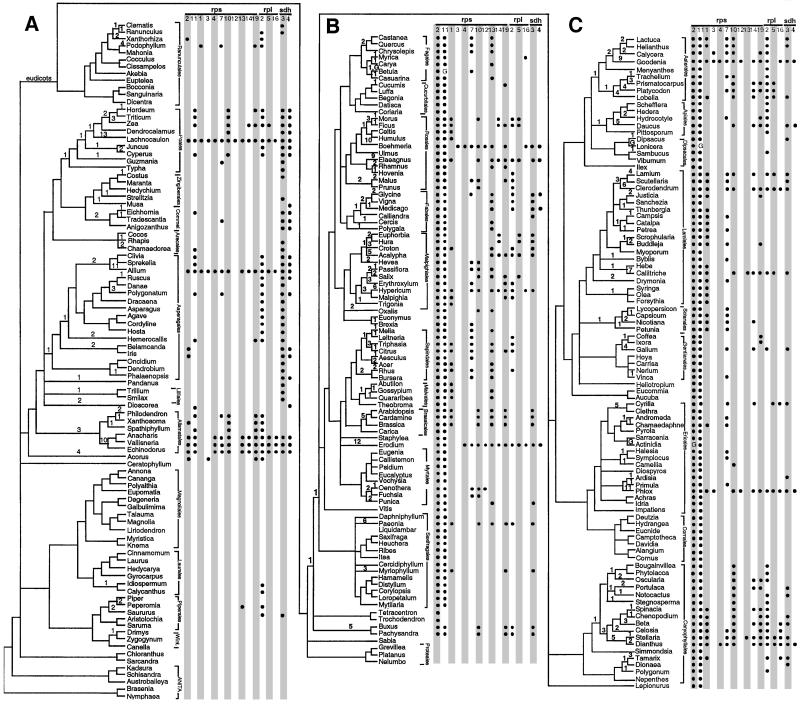
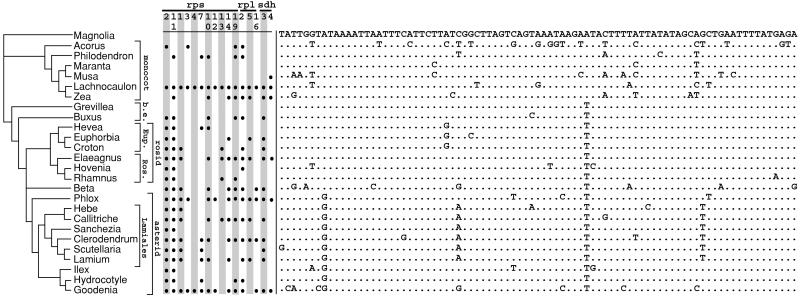
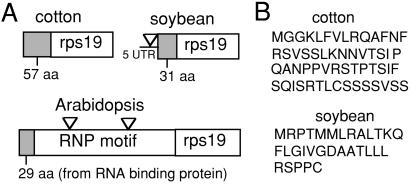
To study the tempo and pattern of mitochondrial gene loss in plants, DNAs from 280 genera of flowering plants were surveyed for the presence or absence of 40 mitochondrial protein genes by Southern blot hybridization. All 14 ribosomal protein genes and both sdh genes have been lost from the mitochondrial genome many times (6 to 42) during angiosperm evolution, whereas only two losses were detected among the other 24 genes. The gene losses have a very patchy phylogenetic distribution, with periods of stasis followed by bursts of loss in certain lineages. Most of the oldest groups of angiosperms are still mired in a prolonged stasis in mitochondrial gene content, containing nearly the same set of genes as their algal ancestors more than a billion years ago. In sharp contrast, other plants have rapidly lost many or all of their 16 mitochondrial ribosomal protein and sdh genes, thereby converging on a reduced gene content more like that of an animal or fungus than a typical plant. In these and many lineages with more modest numbers of losses, the rate of ribosomal protein and sdh gene loss exceeds, sometimes greatly, the rate of mitochondrial synonymous substitutions. Most of these mitochondrial gene losses are probably the consequence of gene transfer to the nucleus; thus, rates of functional gene transfer also may vary dramatically in angiosperms.


Figures

Figure 1
Figure 1
Southern blot hybridizations of 91 angiosperm DNAs (of 280 examined in total) with probes for seven mitochondrial genes.
Figure 2
Figure 2
Inferred losses of mitochondrial ribosomal protein and sdh genes among 280 angiosperms (species names are listed at www.bio.indiana.edu/∼palmerlab.html). Bullets indicate absence of hybridization to the probe in question. Numbers on the branches of the tree indicate inferred numbers of losses per internode. The three Gs indicate hybridizations scored as gains after ancient losses (see Results for explanation). Vertical names with brackets indicate plant orders. (A) Magnoliids (Bottom, Ceratophyllum and below), monocots (Middle, Acorus through Hordeum), and basal eudicots (Top, Dicentra and above). (B) Rosids (Middle and Top, Mytilaria and above) and basal eudicots (Bottom, Tetracentron and below). (C) Asterids (Middle and Top, Cornus and above) and caryophyllids (Bottom, Bougainvillea and below). The tree of the 280 examined angiosperms was constructed by consulting various recent molecular systematics studies. The following were the primary sources of interfamilial relationships: asterids (48) except for Lamiales (49), rosids and caryophyllids (50), basal eudicots (51), monocots (52), and magnoliids (53). Intra-familial relationships were based on various sources listed at www.bio.indiana.edu/∼palmerlab.html. rps10 data are from ref. . rpl2 data are for the 5′ portion of the gene (24). sdh3 and sdh4 data are from ref. .
Figure 3
Figure 3
Comparison of patterns of mitochondrial gene absences and synonymous site differences among selected taxa. Shown are 85 4-fold degenerate, third-position silent sites in cox1 codons specifying amino acids that are invariant among the 26 angiosperms compared. Dots indicate nucleotides identical to the top sequence (Magnolia). The distribution of gene absences and the tree topology are extracted from Fig. 2. Eup. indicates Euphorbiaceae, Ros. indicates Rosales, and b.e. indicates basal eudicots.
Figure 4
Figure 4
Nuclear rps19 gene structures and predicted presequences. (A) Gene structure diagrams. Triangles indicate positions of introns. The Arabidopsis and soybean sequences are genomic; that of cotton is a cDNA. UTR, untranslated region. (B) Presequences of rps19 from cotton and soybean are predicted by mitoprot (34).

References

    1. Gray M W, Lang B F, Cedergren R, Golding G B, Lemieux C, Sankoff D, Turmel M, Brossard N, Delage E, Littlejohn T G, et al. Nucleic Acids Res. 1998;26:865–878. - PMC - PubMed
    1. Lang B F, Gray M W, Burger G. Annu Rev Genet. 1999;33:351–397. - PubMed
    1. Andersson S G E, Zomorodipour A, Andersson J O, Sicheritz-Ponten T, Alsmark U C, Podowski R M, Naslund A K, Eriksson A S, Winkler H H, Kurland C G. Nature (London) 1998;396:133–140. - PubMed
    1. Boore J L. Nucleic Acids Res. 1999;27:1767–1780. - PMC - PubMed
    1. Bensasson D, Zhang D, Hartl D L, Hewitt G M. Trends Ecol Evol. 2001;16:314–321. - PubMed

Publication types

Associated data