. 2002 Jul 23;99(15):10048-53.
doi: 10.1073/pnas.142100999. Epub 2002 Jul 15.

Increased cell proliferation, but not reduced cell death, induces lymphocytosis in bovine leukemia virus-infected sheep

Affiliations

Increased cell proliferation, but not reduced cell death, induces lymphocytosis in bovine leukemia virus-infected sheep

Christophe Debacq et al. Proc Natl Acad Sci U S A. .

Abstract

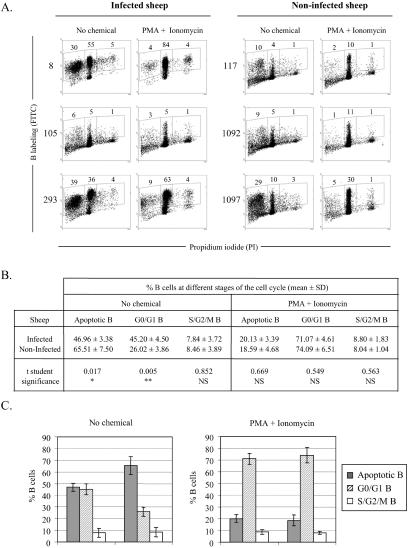
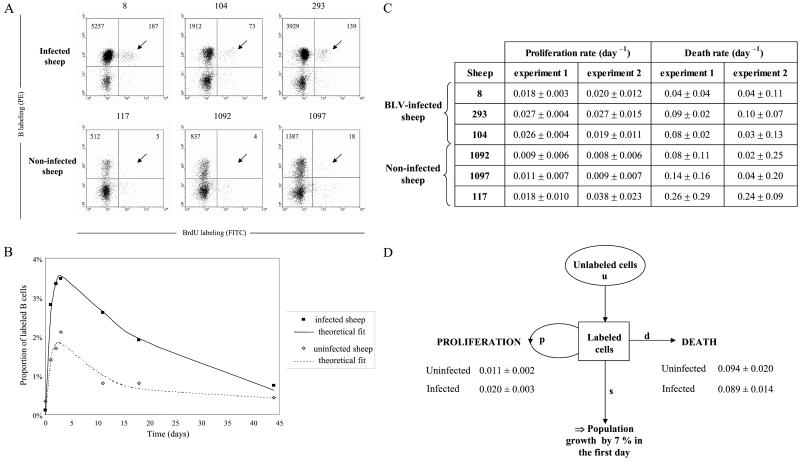
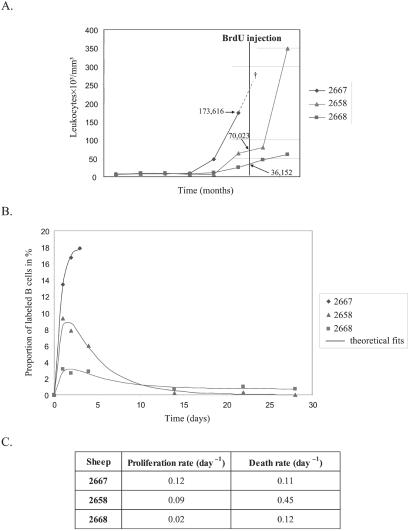
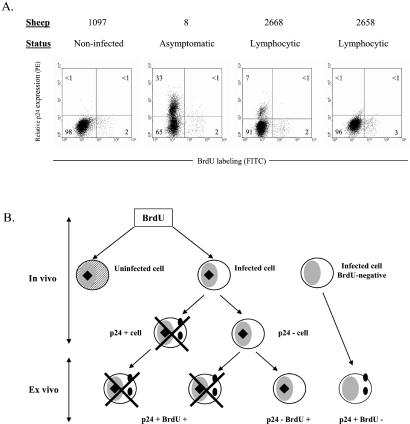
Lymphocyte homeostasis is the result of a critical balance between cell proliferation and death. Disruption of this subtle equilibrium can lead to the onset of leukemia, an increase in the number of lymphocytes being potentially due to both of these parameters. The relative importance of cell proliferation vs. apoptosis during pathogenesis induced by the primate T cell lymphotropic viruses and bovine leukemia virus (BLV) has been difficult to assess because of conflicting data from a range of in vitro and ex vivo experimental systems. Here, we aim to resolve this issue by measuring the rates of cell proliferation and death in the BLV-ovine system, an animal model of human T lymphotropic virus (HTLV-1). We use a method based on the i.v. injection of 5-bromodeoxyuridine into BLV-infected sheep. We show that B lymphocytes in BLV(+) asymptomatic sheep proliferate significantly faster than in uninfected controls (average proliferation rate: 0.020 per day vs. 0.011 per day). In contrast, the rates of cell death were not significantly different between aleukemic BLV-infected and control sheep (average death rate 0.089 per day vs. 0.094 per day, respectively). We conclude that the increase in the number of B cells during BLV-induced lymphocytosis results from higher proliferation rates but is not due to a significant decrease in apoptosis, in contrast to data from in vitro (ex vivo) experiments. The imbalance created by the net increase in proliferation in the absence of compensating cell death reveals a complex mechanism of feedback regulation controlling homeostasis in the blood compartment.


Figures

Figure 1
Figure 1
Apoptosis in short-term cultures of sheep PBMCs. (A) PBMCs were isolated from BLV-infected sheep (nos. 8, 105, and 293) and seronegative controls (nos. 117, 1092, and 1097). Cells were cultivated for 18 h in the absence (no chemical) or in the presence of PMA + Ionomycin and labeled with anti-IgM monoclonal antibody 1H4 and an FITC conjugate. After ethanol fixation, the cells were stained with PI and, after exclusion of the doublets, analyzed by two-color flow cytometry. Results from a representative experiment (10,000 events) are shown as dot plots (x axis, PI; y axis, B lymphocytes). Numbers within the plots represent the percentages of positively stained B cells within each region. (B) Mean percentages (± SD) of B lymphocytes at different stages of the cell cycle (subG1/apoptotic, G0/G1, S+G2/M) were calculated from three independent experiments by using cells isolated from infected animals (nos. 8, 105, and 293) and negative controls (nos. 117, 1092, and 1097). **, P < 0.01; *, P < 0.05; NS, not statistically significant, as determined by Student's t test. (C) Graphic representation of the mean values and SDs from B.
Figure 2
Figure 2
BrdUrd incorporation into B lymphocytes in vivo. (A) Three BLV-infected sheep (nos. 8, 104, and 293) and three controls (nos. 117, 1092, and 1097) were injected intravenously with 500 mg BrdUrd, and an aliquot of blood (1 ml) was collected 3 days later. After lysis of the red blood cells, B cells were labeled with biotinylated 1H4 monoclonal antibody and streptavidin-PE conjugate. Then, the cells were stained with anti-BrdUrd FITC antibody in the presence of DNase and analyzed by two-color flow cytometry (x axis, BrdUrd; y axis, B lymphocytes). Ten thousand cells (lymphocytes, monocytes, and granulocytes) were acquired, and PBMCs were selected by the FSC/SSC gating. The total numbers of B cells are indicated in the upper quadrants. (B) Kinetic analysis of BrdUrd+ B cells. Blood samples from six sheep (see A) were collected at different days after BrdUrd injection. The ratio (in %) of BrdUrd+ cells within the total B lymphocyte population was determined, and the data corresponding to the measured incorporation rates were fitted to a mathematical model, yielding a theoretical fit (see Materials and Methods). Figure shows the average data for the three infected and the three control sheep. (C) Minimal proliferation and death rates (± SD) estimated from fitting the source model to the data deduced from two independent experiments. (D) Summary of the proliferation and death rates (± SD) and estimation of the population growth.
Figure 3
Figure 3
B cell proliferation and renewal in leukemic sheep. (A) Evolution of leukocyte counts (y axis in 103 cells per mm3) with time (x axis in months). Sheep 2667 died at day 3 of the study (†). Arrows indicate the estimated cell counts. (B) Percentages of B cells labeled with BrdUrd and the theoretical fit. (C) Minimal proliferation and death rates were estimated from fitting a theoretical model to the BrdUrd labeling and weighted extrapolated leukocyte count data.
Figure 4
Figure 4
Proliferation and viral expression. (A) Two days after BrdUrd injection, PBMCs from noninfected (no. 1097), asymptomatic (no. 8), and lymphocytic (nos. 2668 and 2658) sheep were isolated and cultivated during 18 h. The cells then were fixed and incubated with anti-p24 antibody 4′G9, which recognizes the viral capsid protein, and with a PE-conjugated secondary antibody. Finally, cells were stained with anti-BrdUrd FITC with DNase and analyzed by flow cytometry. A representative experiment (out of three) is represented by dot plots (10,000 selected events). Numbers represent the percentages of positively stained cells in each quadrant. (B) Schematic representation of BrdUrd incorporation in vivo (hypothetical) and p24 labeling after short-term culture (ex vivo). Hatched areas represent the uninfected cell; black squares and full circles indicate BrdUrd and p24 markers, respectively. Crosses indicate that cells were undetectable by FACS.

References

    1. Gallo R C. Nat Med. 1995;1:753–759. - PubMed
    1. Yoshida M. Gann. 1983;74:777–789. - PubMed
    1. Ferrer J F, Marshak R R, Abt D A, Kenyon S J. Ann Rech Vet. 1978;9:851–857. - PubMed
    1. Burny A, Cleuter Y, Kettmann R, Mammerickx M, Marbaix G, Portetelle D, Van den Broecke A, Willems L, Thomas R. Adv Vet Sci Comp Med. 1988;32:149–170. - PubMed
    1. Kettmann R, Portetelle D, Mammerickx M, Cleuter Y, Dekegel D, Galoux M, Ghysdael J, Burny A, Chantrenne H. Proc Natl Acad Sci USA. 1976;73:1014–1018. - PMC - PubMed

Publication types

LinkOut - more resources