. 2002 Jul 15;22(14):6062-70.
doi: 10.1523/JNEUROSCI.22-14-06062.2002.

Synchronous neuronal activity is a signal for axonal sprouting after cortical lesions in the adult

Affiliations

Synchronous neuronal activity is a signal for axonal sprouting after cortical lesions in the adult

S Thomas Carmichael et al. J Neurosci. .

Abstract

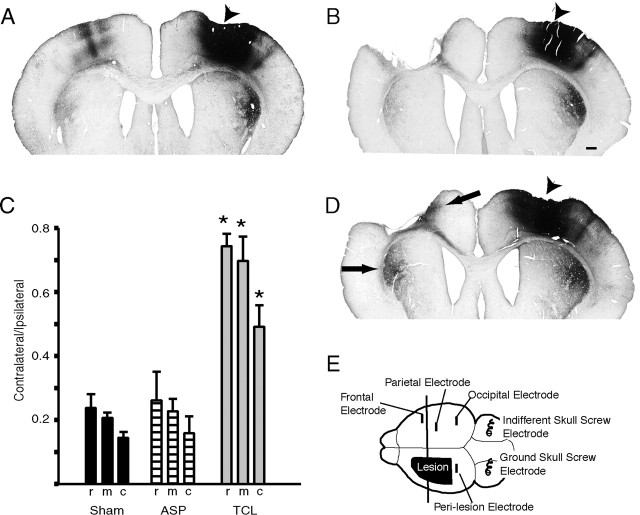
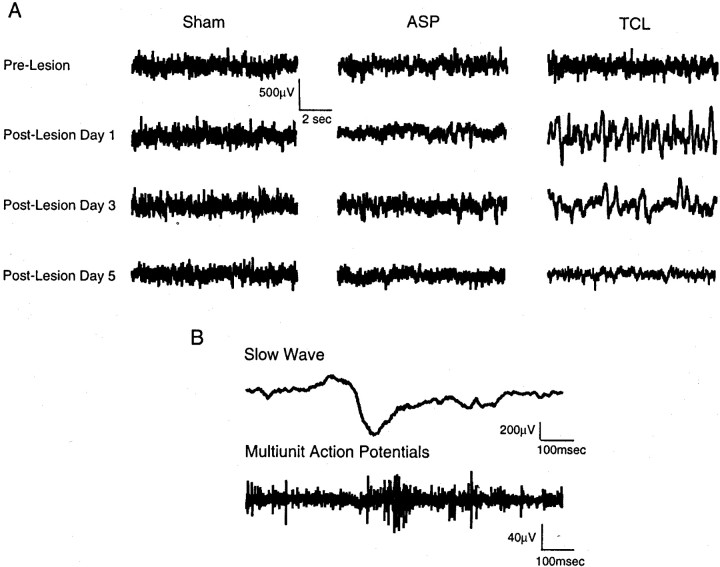
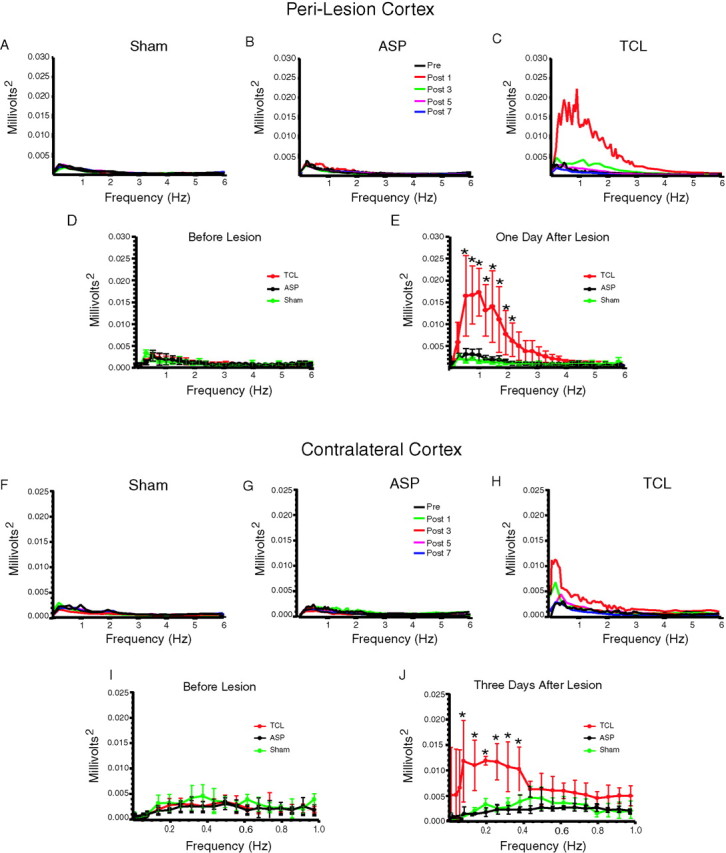
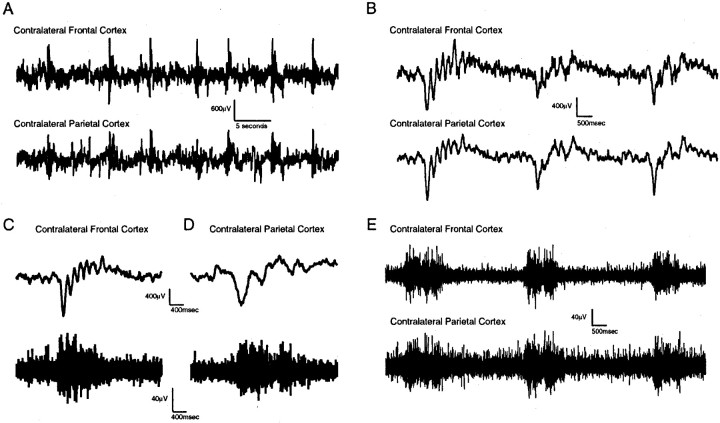
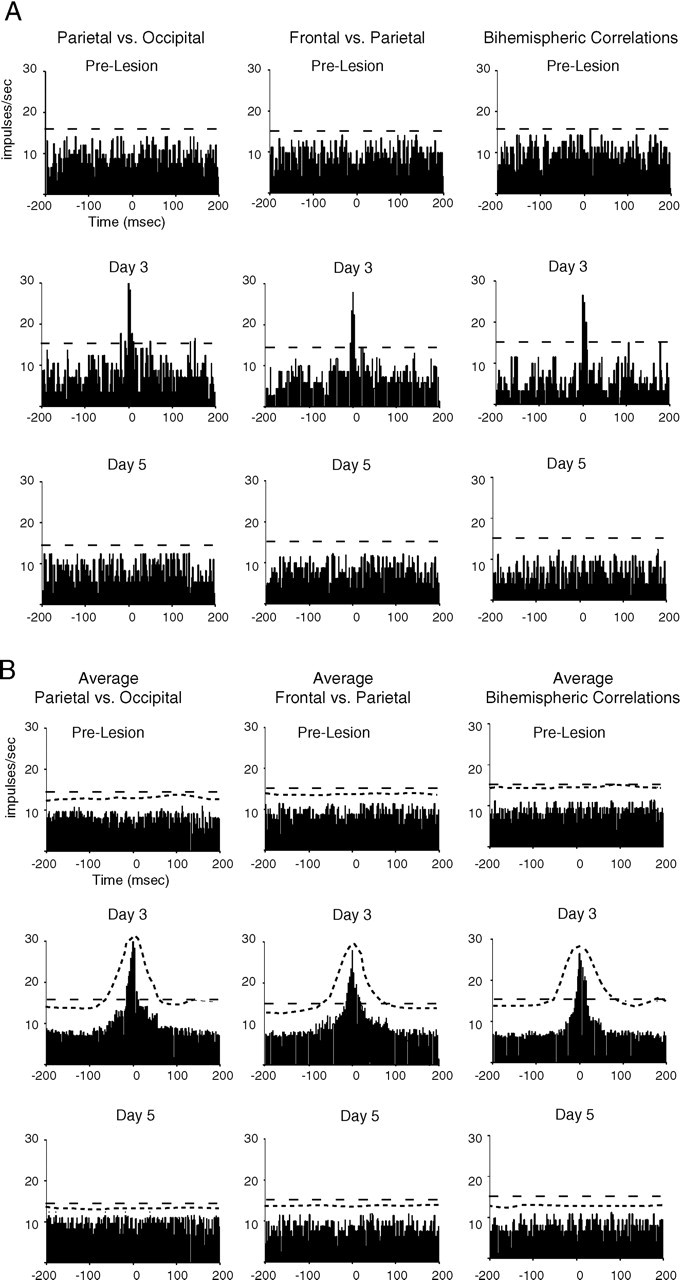
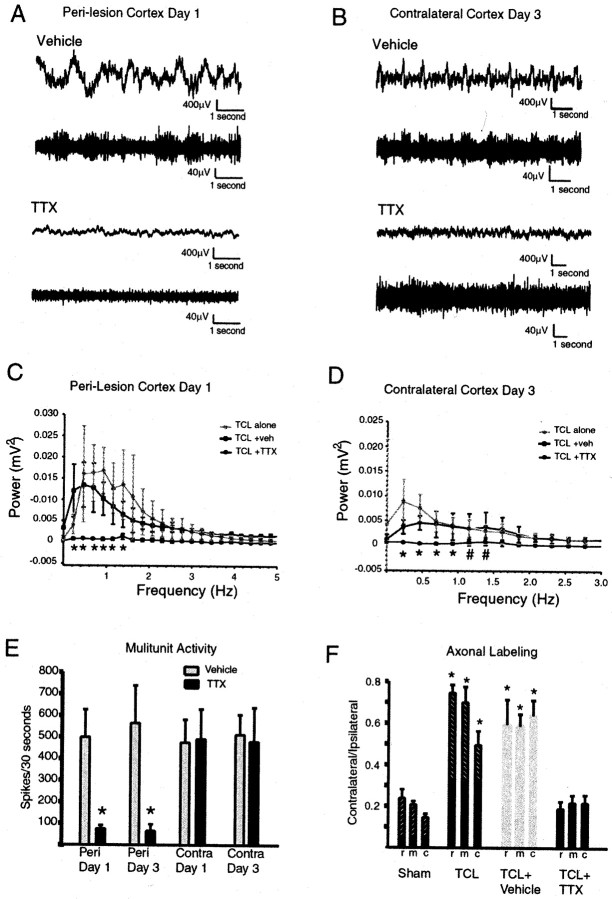
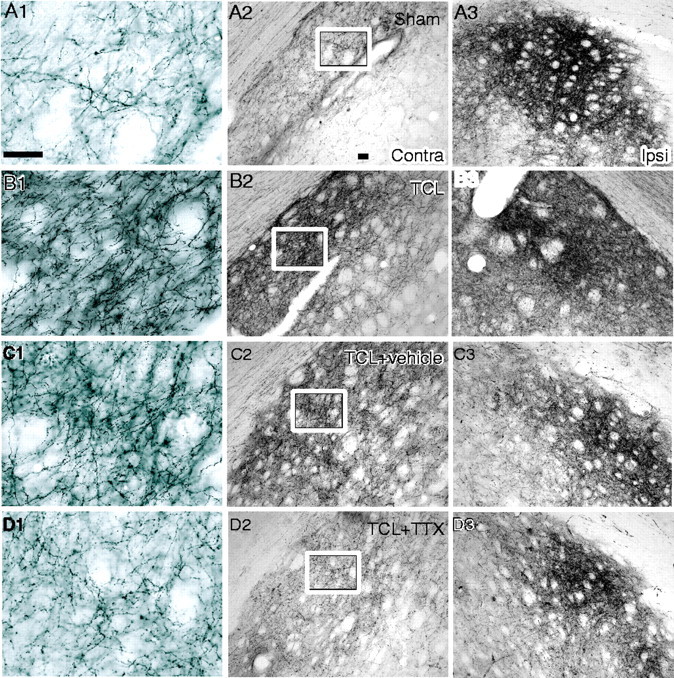
The ability of the adult brain to form new connections in areas denervated by a lesion (axonal sprouting) is more widespread than previously thought, but mechanisms remain unknown. We have previously demonstrated an unexpected, robust axonal sprouting of contralateral corticostriatal neurons into the denervated striatum after ischemic cortical lesions. We now take advantage of marked differences in the degree of axonal sprouting from contralateral homotypic cortex after two types of cortical lesions to define the role of neuronal activity in this response. Thermal-ischemic lesions (TCL) of sensorimotor cortex, which induce axonal sprouting, produced two sequential patterns of low-frequency, synchronized neuronal activity that are not seen after similarly sized aspiration lesions, which do not induce axonal sprouting. An early rhythm of synchronous neuronal activity occurred in perilesion cortex on day 1 after lesion, with a frequency range of 0.2-2 Hz. A later pattern of activity occurred on days 2 and 3 after lesion, with a frequency range of 0.1-0.4 Hz. This second rhythm synchronized neuronal activity across widespread areas, including the cortical areas that contain the cell bodies of the sprouting axons. TTX was used to block this patterned neuronal activity and determine whether axonal sprouting was prevented. Chronic TTX infusion into the lesion site blocked the synchronous neuronal activity after TCL as well as axonal sprouting. Thus, both after different types of lesions and in the blockade experiments axonal sprouting was strongly correlated with synchronous neuronal activity, suggesting a role for this activity in anatomical reorganization after brain lesion in the adult.


Figures

Fig. 1.
Fig. 1.
Axonal sprouting after focal cortical lesions. Coronal sections through rat brain with BDA tracer injection (arrowheads) in right frontal cortex and sham (A) and ASP (B) or TCL (D) in left frontoparietal cortex. After TCL (D) there is a substantial increase in axonal labeling in contralateral striatum and in cortex medial to the lesion site (arrows). Scale bar: B, 500 μm.C, Quantification of corticostriatal projections by lesion condition. Measurements are taken from three levels in each animal (r, rostral; m, middle;c, caudal). Asterisks denote significance of p < 0.01 (Tukey–Kramer post hoctest, n = 3; see Results for ANOVA values).E, Electrode placement for in vivophysiological recording. Vertical line represents the level of coronal sections in A, B, andD.
Fig. 2.
Fig. 2.
Spontaneous cortical activity in perilesion cortex. A, Spontaneous cortical activity in single animals over the recording period. Each trace is from a single animal before and after lesion, or from equivalent days after electrode implantation in sham animals. B, Coincident action potential and slow wave activity after TCL. Slow wave activity and multiunit action potential activity taken from the same electrode in perilesion cortex on day 1 after TCL.
Fig. 3.
Fig. 3.
Quantitative analysis of spontaneous cortical activity in perilesion cortex. A–E, Pattern of spontaneous cortical activity in perilesion cortex. The top panels show averaged power spectra in all animals in each group for each time point: A, sham; B, ASP;C, TCL groups. D, E, Quantitative analysis of spontaneous cortical activity in perilesion cortex before in D and 1 d after in E ASP (black) and TCL (red), or at 1 and 2 d after electrode implantation in sham (green) animals. In all cases, graphs are scaled to match that inE. Asterisks denote values significant atp < 0.05 for TCL versus ASP and sham (Tukey–Kramer post hoc test, n = 5; see Results for ANOVA values). F–J, Pattern of spontaneous cortical activity in contralateral cortex. Same conventions as in A–E. The top panels show averaged power spectra for all animals in each group for each time point:F, sham; G, ASP; H, TCL groups. I, J, Quantitative analysis of cortical activity on day 3 in contralateral cortex. Asterisks denote values significant at p < 0.05 for TCL versus ASP and sham (Tukey–Kramer post hoc test,n = 5; see Results for ANOVA values).
Fig. 4.
Fig. 4.
Slow wave and multiunit activity in contralateral cortex after TCL. A, Periodic slow wave activity in cortex contralateral to TCL on day 2 after the lesion. Thetop and bottom traces in each panel were simultaneously recorded from frontal and parietal cortex contralateral to TCL. B, Periodic slow waves on day 3 after TCL in contralateral cortex. Traces are from a different animal than in A and show the morphology of the individual waves. C, D, Simultaneous slow wave and action potential activity in cortex contralateral to TCL on day 3. C andD are taken from recordings from frontal and parietal cortex contralateral to TCL in different animals. E,Coincident multiunit action potential activity in two regions of cortex contralateral to TCL on day 3 in the same animal.
Fig. 5.
Fig. 5.
Cross-correlation of multiunit activity after TCL.A, Correlograms show multiunit activity from one recording site compared with that occurring at a reference site, before and on days 3 and 5 after TCL. Above each column of correlograms the listed site on the left is the reference site. The dashed line in each graph shows the 99% confidence level for a correlation greater than chance. These were computed from one animal. B, Average correlograms for all animals before and on days 3 and 5 after TCL (n= 5). The ordinate shows the average firing frequency in each 2 msec bin. The more closely spaced dashed lineshows the upper limit of the SD for each 2 msec bin. The more broadly spaced dashed line shows the 99% confidence level for a correlation grater than chance.
Fig. 6.
Fig. 6.
TTX blocks action potential activity in perilesion cortex and low-frequency slow waves in both hemispheres. A, B, The top trace in each panel shows slow waves, and the bottom trace shows multiunit activity, simultaneously recorded from the same electrode during either TTX or vehicle infusion. Traces are from different vehicle- and TTX-treated animals. C, Power spectral analysis of effect of TTX infusion on slow wave activity in perilesion cortex. Plots show average and SD of all animals in TCL alone, TCL plus vehicle, and TCL plus TTX groups. Asterisks denotep < 0.05; TCL plus TTX versus TCL alone and versus TCL plus vehicle (Tukey–Kramer post hoc test,n = 5 for each group). D, Power spectral analysis of effect of TTX infusion on slow wave activity in cortex contralateral to the lesion. Asterisks denotep < 0.05; TCL plus TTX versus TCL alone and versus TCL plus vehicle (Tukey–Kramer post hoc test,n = 5 for each group). Pound signdenotes p < 0.05; TCL plus TTX versus TCL alone (Tukey–Kramer post hoc test, n = 5 for each group). E, Effect of TTX on action potential activity. n = 5 for TTX and vehicle groups.Asterisks denote p < 0.001; TTX versus vehicle on day 1; p < 0.003; TTX versus vehicle on day 3 (unpaired Student's t test,n = 5, see Results). F, TTX infusion blocks the increase in the surface area of axonal labeling in contralateral striatum after TCL. Same conventions as in Figure1C. n = 4 TCL plus TTX and TCL plus vehicle, n = 5 for TCL and n = 3 for sham. Asterisks denote p < 0.01 for vehicle and TCL versus sham and TTX (Tukey–Kramer post hoc test).
Fig. 7.
Fig. 7.
Blockade of rhythmic slow wave activity prevents axonal sprouting after TCL. BDA was injected into cortex contralateral to TCL 28 d after the lesion. A, Corticostriatal projections in sham-operated animal. B, Corticostriatal projections in TCL. C, Corticostriatal projections in TCL plus vehicle. D, Corticostriatal projections in TCL plus TTX. The middle column contains photomicrographs from striatum contralateral to the lesion. The right column contains photomicrographs from striatum ipsilateral to the lesion. The left column contains high-powered photomicrographs from the area within the box in themiddle column. Scale bars: A1 (applies toleft column), 50 μm; A2 (applies tomiddle and right columns), 100 μm.

References

    1. Abeles M. Quantification, smoothing, and confidence limits for single-units' histograms. J Neurosci Methods. 1982;5:317–325. - PubMed
    1. Carmichael ST, Wei L, Rovainen CM, Woolsey TA. New patterns of intra-cortical projections after focal cortical stroke. Neurobiol Dis. 2001;8:910–922. - PubMed
    1. Catalona SM, Shatz CJ. Activity-dependent cortical target selection by thalamic axons. Science. 1998;281:559–562. - PubMed
    1. Cohen-Cory S. BDNF modulates, but does not mediate, activity-dependent branching and remodeling of optic axon arbors in vivo. J Neurosci. 1999;19:9996–10003. - PMC - PubMed
    1. Colder BW, Wilson CL, Frysinger RC, Chao LC, Harper RM, Engel J., Jr Neuronal synchrony in relation to burst discharges in epileptic human temporal lobes. J Neurophysiol. 1996;75:2496–2508. - PubMed

Publication types

MeSH terms

LinkOut - more resources