. 2002 Jul 17;3(1):19.
doi: 10.1186/1471-2164-3-19. Epub 2002 Jul 17.

Defining signal thresholds in DNA microarrays: exemplary application for invasive cancer

Affiliations

Defining signal thresholds in DNA microarrays: exemplary application for invasive cancer

M Bilban et al. BMC Genomics. .

Abstract

Background: Genome-wide or application-targeted microarrays containing a subset of genes of interest have become widely used as a research tool with the prospect of diagnostic application. Intrinsic variability of microarray measurements poses a major problem in defining signal thresholds for absent/present or differentially expressed genes. Most strategies have used fold-change threshold values, but variability at low signal intensities may invalidate this approach and it does not provide information about false-positives and false negatives.

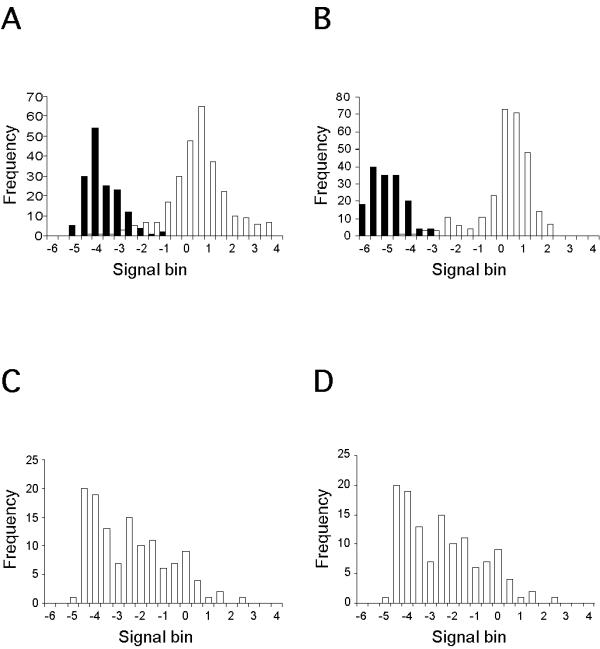
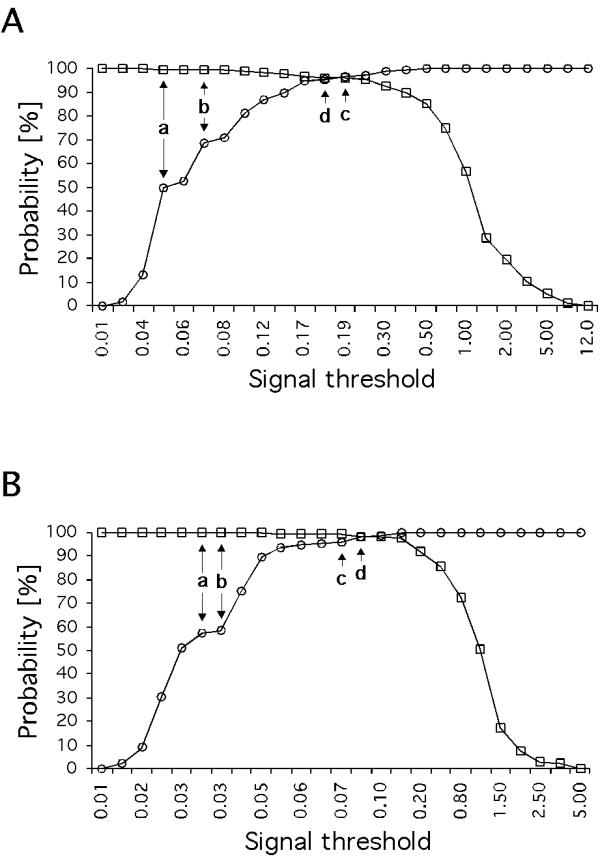
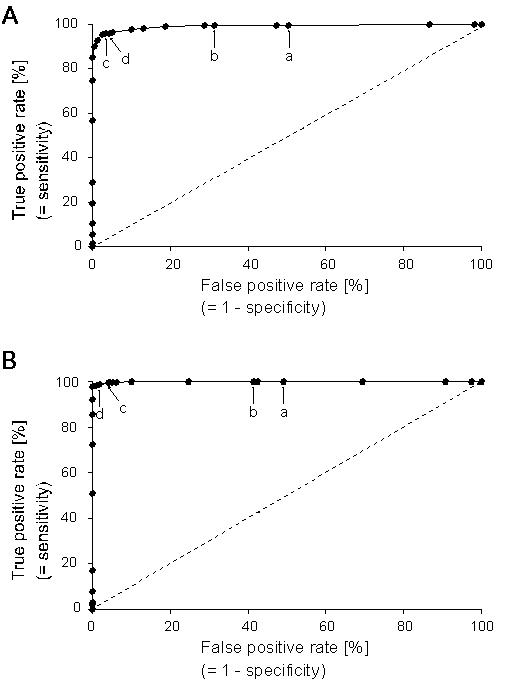
Results: We introduce a method to filter false-positives and false-negatives from DNA microarray experiments. This is achieved by evaluating a set of positive and negative controls by receiver operating characteristic (ROC) analysis. As an advantage of this approach, users may define thresholds on the basis of sensitivity and specificity considerations. The area under the ROC curve allows quality control of microarray hybridizations. This method has been applied to custom made microarrays developed for the analysis of invasive melanoma derived tumor cells. It demonstrated that ROC analysis yields a threshold with reduced missclassified genes in microarray experiments.

Conclusions: Provided that a set of appropriate positive and negative controls is included on the microarray, ROC analysis obviates the inherent problem of arbitrarily selecting threshold levels in microarray experiments. The proposed method is applicable to both custom made and commercially available DNA microarrays and will help to improve the reliability of predictions from DNA microarray experiments.


Figures

Figure 1
Figure 1
Signal distributions for specific and non-specific hybridizations overlap at low absolute intensities. The median intensity of 4 B.subtilis genes (n = 24 replicates per gene × 4 = 96) was used as a linear scaling factor to balance the Cy3 and Cy5 channels. Following this normalization step, normalized intensities were Log2 transformed for efficient graphical illustration. Positive control spots (open bars) and negative control spots (filled bars) from (A) array 1 and (B) array 2 microarray hybridizations. The positive control group includes seven housekeeping genes (n = 42) and four B.subtilis genes (24 repeats per sequence; n = 96) representing sequence-specific hybridization. The negative control sequences (six repeats per sequence) include three plant genes (n = 18), three E. coli genes (n = 18), and seven human cytomegalovirus (hCMV) genes (n = 42) representing non-specific hybridization events. Data for Cy3 and Cy5 signals were pooled. Signal distributions for test genes (n = 154) from (C) array 1 and (D) array 2.
Figure 2
Figure 2
Specificity and sensitivity of select cut-offs for individual microarrays. Specific (spiked B. subtilis and housekeepers) and non-specific hybridization control groups (plant, bacterial and viral genes) represent sensitivity (squares) and specificity (circles), respectively. The intersection point of the two graphs indicates the threshold TM at which Sp equals Se. TM values were 0.18 (array1) and 0.09 (array 2). Indicated thresholds a-d are described in table 1. The Tj values presented in Table 1 were used to construct these curves. Note the different signal range (abcissa values) for array 1 (A) and array 2 (B).
Figure 3
Figure 3
ROC analysis of selected signal cut-off values as a predictor for specific hybridization. ROC curves demonstrate the capacity to discriminate between the absence or presence of sequence-specific hybridization in individual microarray experiments. The closer an ROC curve is to the upper left hand corner of the graph, the more accurate it is because the true positive rate is 100% and the false positive rate is 0%. ROC plots based on percentile rank calculations for 25 cut-off signal thresholds (taken from table 1). The meaning of the position of thresholds a-d (table 1) are explained in the text. The area under the ROC curve was (A) 0.994 (array 1) and (B) 0.999 (array 2). Rising diagonal indicates no discrimination between positiv and negative control signals.

References

    1. Young RA. Biomedical discovery with DNA arrays. Cell. 2000;102:9–15. - PubMed
    1. Bilban M, Head S, Desoye G, Quaranta V. DNA microarrays: a novel approach to investigate genomics in trophoblast invasion – a review. Placenta. 2000;21:S99–105. - PubMed
    1. Claverie JM. Computational methods for the identification of differential and coordinated gene expression. Hum Mol Genet. 1999;8:1821–1832. doi: 10.1093/hmg/8.10.1821. - DOI - PubMed
    1. Kane MD, Jatkoe TA, Stumpf CR, Lu J, Thomas JD, Madore SJ. Assessment of the sensitivity and specificity of oligonucleotide (50 mer) microarrays. Nucleic Acids Res. 2000;28:4552–4557. doi: 10.1093/nar/28.22.4552. - DOI - PMC - PubMed
    1. Lee ML, Kuo FC, Whitmore GA, Sklar J. Importance of replication in microarray gene expression studies: statistical methods and evidence from repetitive cDNA hybridizations. Proc Natl Acad Sci U S A. 2000;97:9834–9839. doi: 10.1073/pnas.97.18.9834. - DOI - PMC - PubMed