

Comparative sequence analysis of the largest E1A proteins of human and simian adenoviruses
- PMID: 12134001
- PMCID: PMC155151
- DOI: 10.1128/jvi.76.16.7968-7975.2002
Comparative sequence analysis of the largest E1A proteins of human and simian adenoviruses
Abstract
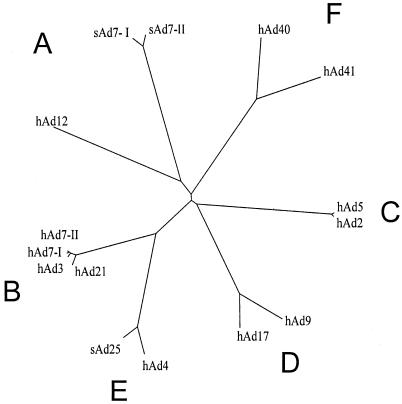
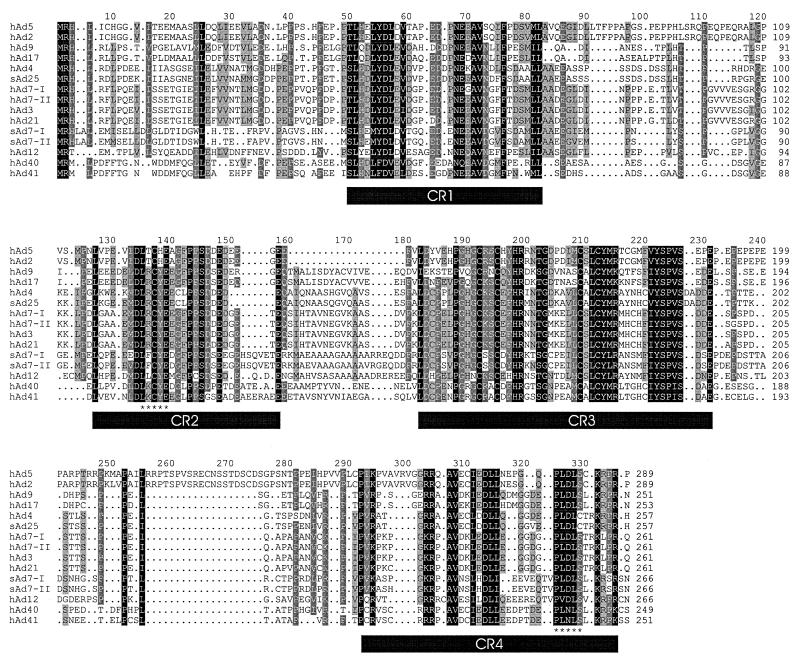
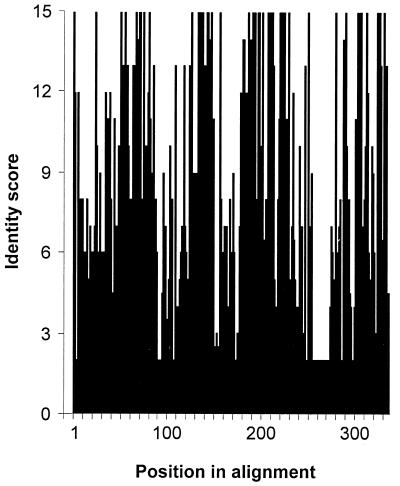
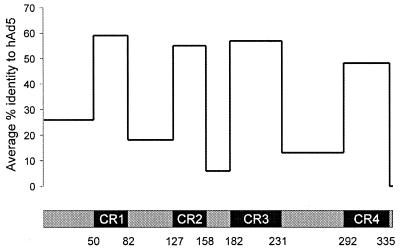
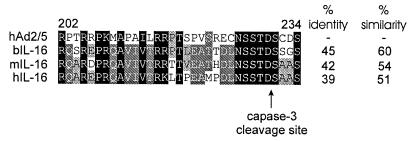
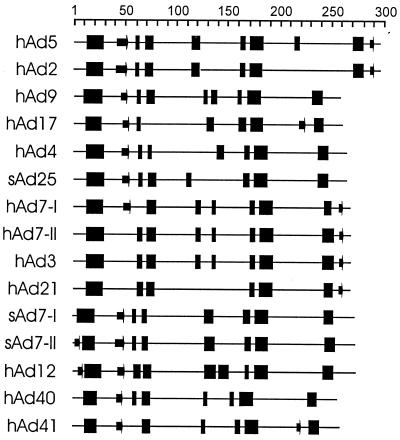
The early region 1A (E1A) gene is the first gene expressed after infection with adenovirus and has been most extensively characterized in human adenovirus type 5 (hAd5). The E1A proteins interact with numerous cellular regulatory proteins, influencing a variety of transcriptional and cell cycle events. For this reason, these multifunctional proteins have been useful as tools for dissecting pathways regulating cell growth and gene expression. Despite the large number of studies using hAd5 E1A, relatively little is known about the function of the E1A proteins of other adenoviruses. In 1985, a comparison of E1A sequences from three human and one simian adenovirus identified three regions with higher overall levels of sequence conservation designated conserved regions (CR) 1, 2, and 3. As expected, these regions are critical for a variety of E1A functions. Since that time, the sequences of several other human and simian adenovirus E1A proteins have been determined. Using these, and two additional sequences that we determined, we report here a detailed comparison of the sequences of 15 E1A proteins representing each of the six hAd subgroups and several simian adenoviruses. These analyses refine the positioning of CR1, 2, and 3; define a fourth CR located near the carboxyl terminus of E1A; and suggest several new functions for E1A.
Figures
References
-
- Altschul, S. F., W. Gish, W. Miller, E. W. Myers, and D. J. Lipman. 1990. Basic local alignment search tool. J. Mol. Biol. 215:403-410. - PubMed
-
- Arany, Z., D. Newsome, E. Oldread, D. M. Livingston, and R. Eckner. 1995. A family of transcriptional adaptor proteins targeted by the E1A oncoprotein. Nature 374:81-84. - PubMed
-
- Avvakumov, N., M. Sahbegovic, Z. Zhang, M. Shuen, and J. S. Mymryk. 2002. Analysis of DNA binding by the adenovirus type 5 E1A oncoprotein. J. Gen. Virol. 83:517-524. - PubMed
-
- Bayley, S. T., and J. S. Mymryk. 1994. Adenovirus E1A proteins and transformation. Int. J. Oncol. 5:425-444. - PubMed
-
- Boyd, J. M., P. M. Loewenstein, Q. Q. Tang, L. Yu, and M. Green. 2002. Adenovirus E1A N-terminal amino acid sequence requirements for repression of transcription in vitro and in vivo correlate with those required for E1A interference with TBP-TATA complex formation. J. Virol. 76:1461-1474. - PMC - PubMed
Publication types
MeSH terms
Substances
LinkOut - more resources
Full Text Sources
Other Literature Sources
Research Materials
