. 2002 Aug;76(16):8285-97.
doi: 10.1128/jvi.76.16.8285-8297.2002.

Mammalian reovirus nonstructural protein microNS forms large inclusions and colocalizes with reovirus microtubule-associated protein micro2 in transfected cells

Affiliations

Mammalian reovirus nonstructural protein microNS forms large inclusions and colocalizes with reovirus microtubule-associated protein micro2 in transfected cells

Teresa J Broering et al. J Virol. 2002 Aug.

Abstract

Cells infected with mammalian orthoreoviruses contain large cytoplasmic phase-dense inclusions believed to be the sites of viral replication and assembly, but the morphogenesis, structure, and specific functions of these "viral factories" are poorly understood. Using immunofluorescence microscopy, we found that reovirus nonstructural protein microNS expressed in transfected cells forms inclusions that resemble the globular viral factories formed in cells infected with reovirus strain type 3 Dearing from our laboratory (T3D(N)). In the transfected cells, the formation of microNS large globular perinuclear inclusions was dependent on the microtubule network, as demonstrated by the appearance of many smaller microNS globular inclusions dispersed throughout the cytoplasm after treatment with the microtubule-depolymerizing drug nocodazole. Coexpression of microNS and reovirus protein micro2 from a different strain, type 1 Lang (T1L), which forms filamentous viral factories, altered the distributions of both proteins. In cotransfected cells, the two proteins colocalized in thick filamentous structures. After nocodazole treatment, many small dispersed globular inclusions containing microNS and micro2 were seen, demonstrating that the microtubule network is required for the formation of the filamentous structures. When coexpressed, the micro2 protein from T3D(N) also colocalized with microNS, but in globular inclusions rather than filamentous structures. The morphology difference between the globular inclusions containing microNS and micro2 protein from T3D(N) and the filamentous structures containing microNS and micro2 protein from T1L in cotransfected cells mimicked the morphology difference between globular and filamentous factories in reovirus-infected cells, which is determined by the micro2-encoding M1 genome segment. We found that the first 40 amino acids of microNS are required for colocalization with micro2 but not for inclusion formation. Similarly, a fusion of microNS amino acids 1 to 41 to green fluorescent protein was sufficient for colocalization with the micro2 protein from T1L but not for inclusion formation. These observations suggest a functional difference between microNS and microNSC, a smaller form of the protein that is present in infected cells and that is missing amino acids from the amino terminus of microNS. The capacity of microNS to form inclusions and to colocalize with micro2 in transfected cells suggests a key role for microNS in forming viral factories in reovirus-infected cells.


Figures
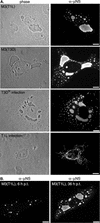
FIG. 1.
FIG. 1.
Distribution of μNS in transfected and reovirus-infected cells. (A) Phase-contrast microscopy (left column) and IF microscopy (right column) of CV-1 cells transfected (upper four panels) with 2 μg of pCI-M3(T1L) or pCI-M3(T3D) per well or infected (lower four panels) with T3DN or T1L at a multiplicity of infection of 5. The cells were fixed at 18 h p.t. or p.i. and immunostained with rabbit anti-μNS IgG directly conjugated to Texas red (T3DN and T1L infection) or Oregon green [pCI-M3(T3D) transfection] or immunostained with rabbit anti-μNS serum followed by goat anti-rabbit IgG conjugated to Alexa 488 [pCI-M3(T1L) transfection]. (B) CV-1 cells transfected with 2 μg of pCI-M3(T1L) per well were fixed at 6 h p.t. (left) or 36 h p.t. (right) and immunostained with Oregon green-conjugated anti-μNS rabbit IgG. Bars, 10 μm.
FIG. 2.
FIG. 2.
Distribution of μNS(T1L) and β-tubulin in transfected cells with and without nocodazole treatment. CV-1 cells transfected with 2 μg of pCI-M3(T1L) per well were left untreated (upper panels), treated with 10 μM nocodazole added at 6 h p.t. (middle panels), or treated with 10 μM nocodazole added at 17 h p.t. (lower panels). The cells were fixed at 18 h p.t. and immunostained with Oregon green-conjugated anti-μNS rabbit IgG (red) (first column) and Cy3-conjugated mouse monoclonal antibody to β-tubulin (green) (second column). Nuclei were counterstained with DAPI (blue). The boxed area in the merged image (third column) is enlarged to show detail (inset). Bars, 10 μm.
FIG. 3.
FIG. 3.
Colocalization of μNS(T1L) and μ2 in cotransfected cells. (A) CV-1 cells were cotransfected with 1 μg of pCI-M3(T1L) and 1 μg of pCI-M1(T1L) (upper panels) or 1 μg of pCI-M3(T1L) and 1 μg of pCI-M1(T3DN) (lower panels) per well and fixed at 18 h p.t. Cells were immunostained with Texas red-conjugated anti-μNS rabbit IgG (red) (first column) and Oregon green-conjugated μ2 rabbit IgG (green) (second column). Nuclei were counterstained with DAPI (blue). (B) CV-1 cells were transfected with 2 μg of pCI-M1(T1L) (left) or pCI-M1(T3DN) (middle and right) per well, fixed at 18 h p.t., and stained with rabbit anti-μ2 polyclonal serum and goat anti-rabbit IgG conjugated to Alexa 488. Bars, 10 μm.
FIG.4.
FIG.4.
Morphologies of μNS/μ2 structures with different relative levels of expression of μNS(T1L) and μ2. (A) CV-1 cells were cotransfected with 2 μg of DNA (total) of pCI-M3(T1L) and pCI-M1(T1L) (upper six panels) or pCI-M3(T1L) and pCI-M1(T3DN) (lower six panels) with different ratios of M3 DNA to M1 DNA (8:1, 1:1, and 1:8) per well. Cells were fixed at 18 h p.t. and immunostained for μNS (left column) and μ2 (right column) as described in the legend to Fig. 3A. Bars, 10 μm. (B) CV-1 cells were transfected with 1 μg of pCI-M3(T1L), pCI-M1(T1L), or pCI-M1(T3DN) and 1 μg of pCI-neo as a carrier plasmid per well and cotransfected as described above. CV-1 cells were infected (inf) with T1L or T3DN at a multiplicity of infection of 5. Lysates were collected at 18 h p.t. or p.i. and analyzed by SDS-PAGE and immunoblotting with polyclonal μNS and μ2 antisera (α-μNS and α-μ2, respectively). A band appearing in untransfected CV-1 cells is indicated on the right with an asterisk. The positions of μNS and μ2 are indicated on the right.
FIG. 5.
FIG. 5.
Distribution of μNS(T1L) and β-tubulin in cells coexpressing μNS(T1L) and μ2. CV-1 cells were transfected with 1.75 μg of pCI-M3(T1L) and 0.25 μg of pCI-M1(T1L) (upper panels) or 1.75 μg of pCI-M3(T1L) and 0.25 μg of pCI-M1(T3DN) (lower panels) per well. Cells were fixed at 18 h p.t. and immunostained for μNS (red) and β-tubulin (green) as described in the legend to Fig. 2. The boxed areas in the merged images are enlarged to show detail (insets). Colinearity of μNS and tubulin is indicated by arrows. Bars, 10 μm.
FIG. 6.
FIG. 6.
Colocalization of μNS(T1L) and μ2 in cotransfected cells treated with nocodazole. CV-1 cells were cotransfected with 1.75 μg of pCI-M3(T1L) and 0.25 μg of pCI-M1(T1L) (upper four panels) or 0.25 μg of pCI-M1(T3DN) (lower four panels) per well. Cells were left untreated or treated with 10 μM nocodazole added at 6 h p.t. (nocodazole), fixed at 18 h p.t., and immunostained for μNS (left column) and μ2 (right column) as described in the legend to Fig. 3A. Bars, 10 μm.
FIG. 7.
FIG. 7.
Distribution of μNS(41-721) in transfected cells with and without μ2 coexpression. (A) CV-1 cells were transfected with 1 μg of pCI-M3(T1L) or pCI-M3(41-721) and 1 μg of pCI-neo as a carrier plasmid per well. CV-1 cells were infected (inf) with T1L at a multiplicity of infection of 5. Lysates were collected at 18 h p.t. or p.i. and analyzed by SDS-PAGE and immunoblotting with polyclonal antisera specific for full-length μNS (α-μNS) and the N-terminal 41 amino acids of μNS (α-1-41 μNS). A band appearing in untransfected CV-1 cells is indicated on the right with an asterisk. The position of full-length μNS is indicated on the right. (B) Phase-contrast microscopy (left) and IF microscopy (right) of CV-1 cells transfected with 2 μg of pCI-M3(41-721) per well. Cells were fixed at 18 h p.t. and immunostained with Texas red-conjugated anti-μNS rabbit IgG. (C) CV-1 cells were cotransfected with 1 μg of pCI-M3(41-721) and 1 μg of pCI-M1(T1L) (upper panels) or 1 μg of pCI-M3(41-721) and 1 μg of pCI-M1(T3DN) (lower panels) per well and fixed at 18 h p.t. Cells were immunostained for μNS (red) and μ2 (green) as described in the legend to Fig. 3A. Bars, 10 μm.
FIG.8.
FIG.8.
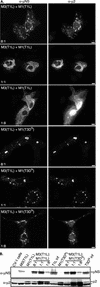
Distribution of GFP, μNS-GFP, and μNS(1-41)-GFP in transfected cells with and without the coexpression of μ2(T1L). (A) CV-1 cells were transfected with 1 μg of pEGFP, pEGFP-M3, orpEGFP-M3(1-41) and 1 μg of pCI-neo as a carrier plasmid per well. Lysates were collected at 18 h p.i. and analyzed by SDS-PAGE and immunoblotting with polyclonal anti-μNS serum (α-μNS) or monoclonal anti-GFP IgG (α-GFP). A band appearing in untransfected CV-1 cells is indicated on the left with an asterisk. The positions of μNS-GFP, μNS(1-41)-GFP, and GFP are indicated on the right. (B) CV-1 cells were transfected with 2 μg of pEGFP (upper left panel), pEGFP-M3 (upper right panel), or pEGFP-M3(1-41) (lower left panel), fixed at 18 h p.t., and immunostained with mouse monoclonal antibody to GFP followed by goat anti-mouse IgG conjugated to Alexa 488. (C) CV-1 cells were cotransfected with 0.25 μg of pEGFP (upper panels), pEGFP-M3 (middle panels), or pEGFP-M3(1-41) (lower panels) and 1.75 μg of pCI-M1(T1L) per well. Cells were fixed at 18 h p.t. and stained for GFP (left column) as described for panel B and μ2 (right column) with rabbit anti-μ2 serum followed by goat anti-rabbit IgG conjugated to Alexa 594. Bars, 10 μm.
FIG. 9.
FIG. 9.
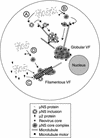
Model for viral factory formation. (A) When expressed in the absence of other viral proteins, μNS forms globular phase-dense inclusions that travel along MTs toward the nucleus. When μ2(T3DN) is coexpressed with μNS, it is recruited to μNS globular inclusions. (B) In a T3DN-infected cell, μNS binds to cores and incorporates them into inclusions to generate a globular viral factory (VF). (C) μNS coats MTs when coexpressed with μ2(T1L), forming filamentous structures. (D) In a T1L-infected cell, cores bound by μNS are recruited to MTs by the μNS/μ2 association, forming a filamentous VF.

Similar articles

Cited by

References

    1. Antczak, J. B., and W. K. Joklik. 1992. Reovirus genome segment assortment into progeny genomes studied by the use of monoclonal antibodies directed against reovirus proteins. Virology 187:760-776. - PubMed
    1. Becker, M. M., M. I. Goral, P. R. Hazelton, G. S. Baer, S. E. Rodgers, E. G. Brown, K. M. Coombs, and T. S. Dermody. 2001. Reovirus σNS protein is required for nucleation of viral assembly complexes and formation of viral inclusions. J. Virol. 75:1459-1475. - PMC - PubMed
    1. Blackhall, J., A. Fuentes, K. Hansen, and G. Magnusson. 1997. Serine protein kinase activity associated with rotavirus phosphoprotein NSP5. J. Virol. 71:138-144. - PMC - PubMed
    1. Brentano, L., D. L. Noah, E. G. Brown, and B. Sherry. 1998. The reovirus protein μ2, encoded by the M1 gene, is an RNA-binding protein. J. Virol. 72:8354-8357. - PMC - PubMed
    1. Broering, T. J., A. M. McCutcheon, V. E. Centonze, and M. L. Nibert. 2000. Reovirus nonstructural protein μNS binds to core particles but does not inhibit their transcription and capping activities. J. Virol. 74:5516-5524. - PMC - PubMed

Publication types

MeSH terms

LinkOut - more resources