. 2002 Jul;13(7):2502-17.
doi: 10.1091/mbc.01-11-0529.

Expression of caveolin-1 induces premature cellular senescence in primary cultures of murine fibroblasts

Affiliations

Expression of caveolin-1 induces premature cellular senescence in primary cultures of murine fibroblasts

Daniela Volonte et al. Mol Biol Cell. 2002 Jul.

Abstract

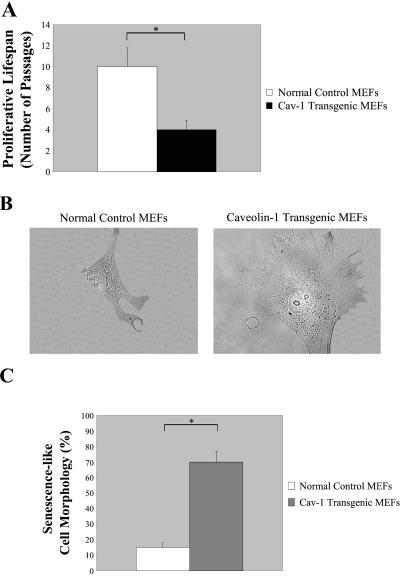
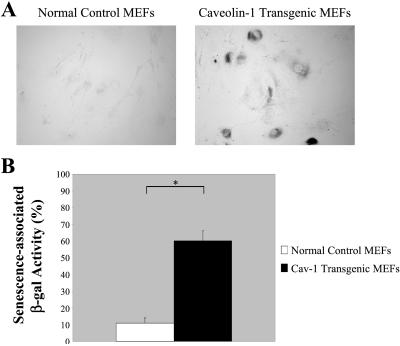
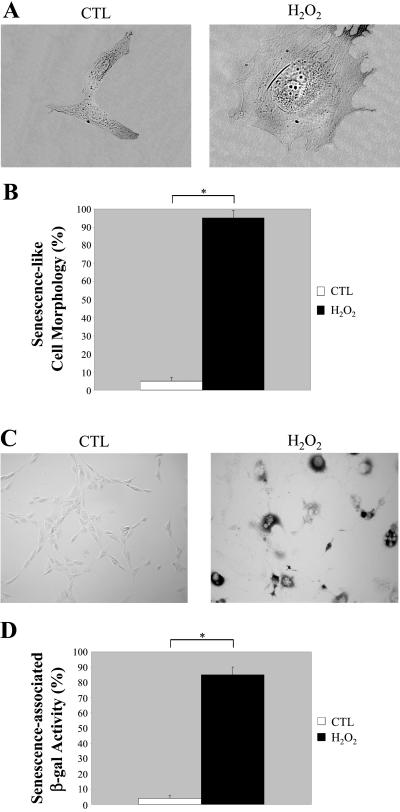
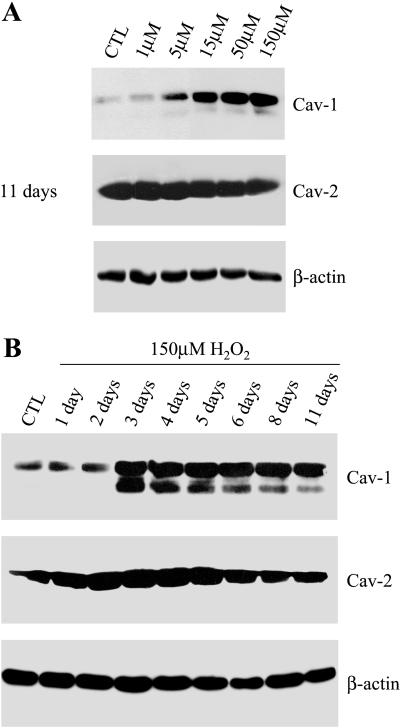
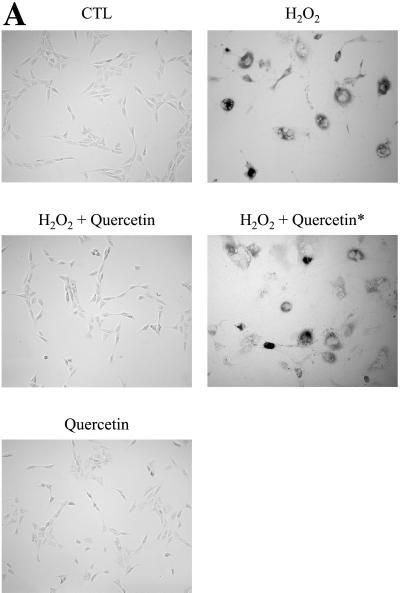
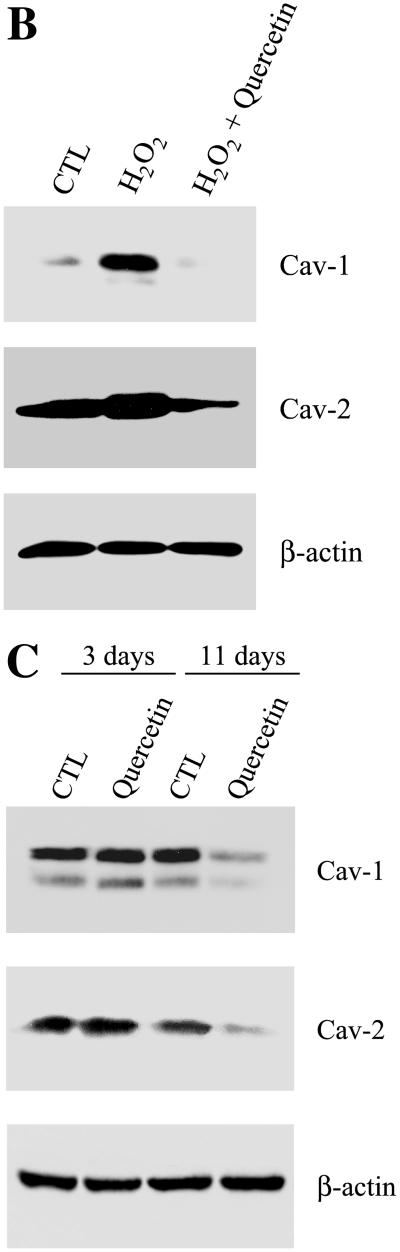
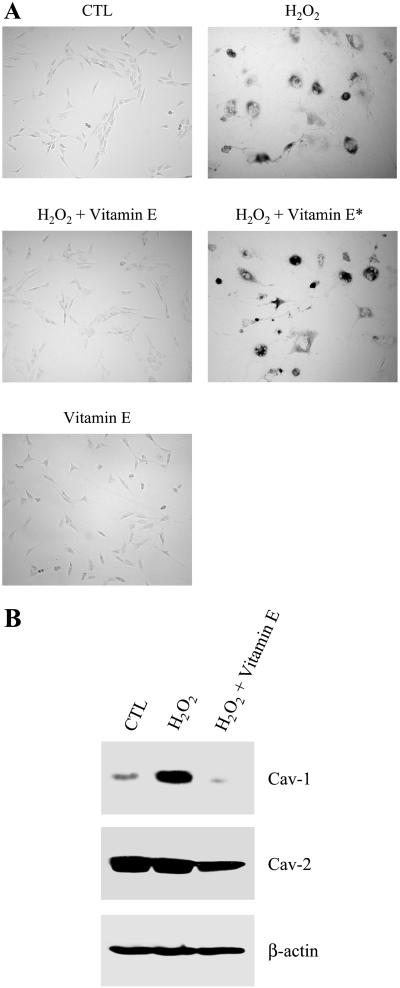
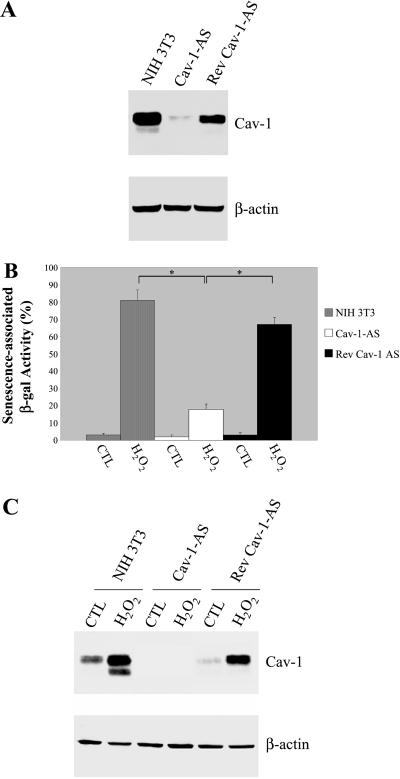
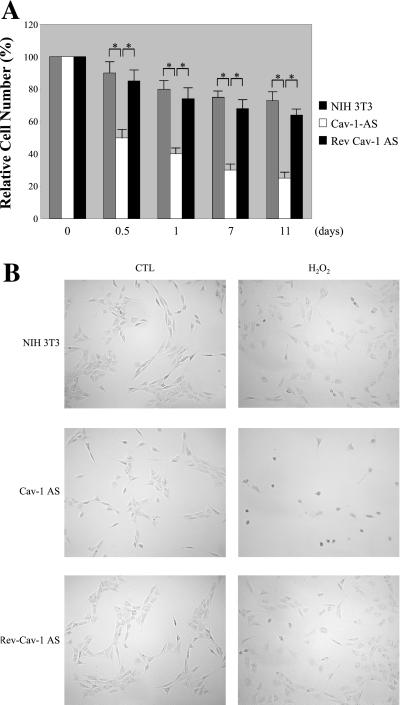
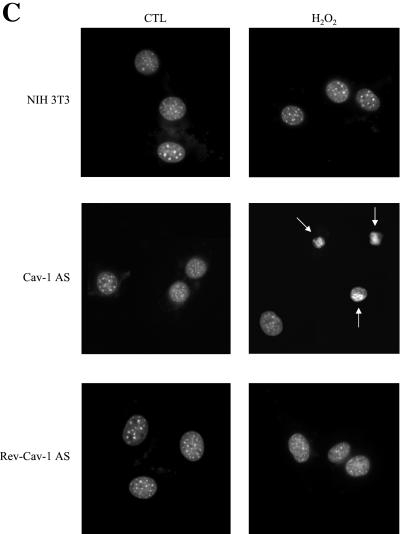
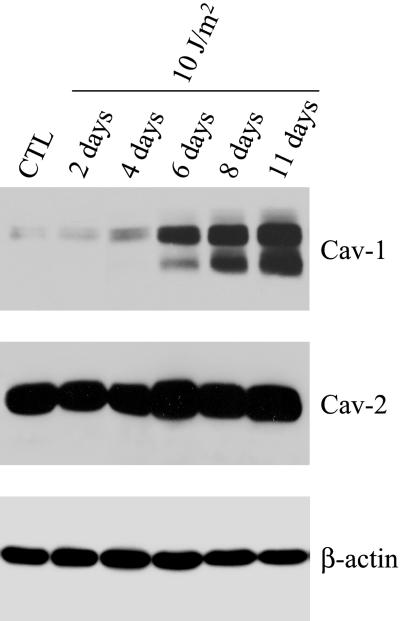
Caveolae are vesicular invaginations of the plasma membrane. Caveolin-1 is the principal structural component of caveolae in vivo. Several lines of evidence are consistent with the idea that caveolin-1 functions as a "transformation suppressor" protein. In fact, caveolin-1 mRNA and protein expression are lost or reduced during cell transformation by activated oncogenes. Interestingly, the human caveolin-1 gene is localized to a suspected tumor suppressor locus (7q31.1). We have previously demonstrated that overexpression of caveolin-1 arrests mouse embryonic fibroblasts in the G(0)/G(1) phase of the cell cycle through activation of a p53/p21-dependent pathway, indicating a role of caveolin-1 in mediating growth arrest. However, it remains unknown whether overexpression of caveolin-1 promotes cellular senescence in vivo. Here, we demonstrate that mouse embryonic fibroblasts transgenically overexpressing caveolin-1 show: 1) a reduced proliferative lifespan; 2) senescence-like cell morphology; and 3) a senescence-associated increase in beta-galactosidase activity. These results indicate for the first time that the expression of caveolin-1 in vivo is sufficient to promote and maintain the senescent phenotype. Subcytotoxic oxidative stress is known to induce premature senescence in diploid fibroblasts. Interestingly, we show that subcytotoxic level of hydrogen peroxide induces premature senescence in NIH 3T3 cells and increases endogenous caveolin-1 expression. Importantly, quercetin and vitamin E, two antioxidant agents, successfully prevent the premature senescent phenotype and the up-regulation of caveolin-1 induced by hydrogen peroxide. Also, we demonstrate that hydrogen peroxide alone, but not in combination with quercetin, stimulates the caveolin-1 promoter activity. Interestingly, premature senescence induced by hydrogen peroxide is greatly reduced in NIH 3T3 cells harboring antisense caveolin-1. Importantly, induction of premature senescence is recovered when caveolin-1 levels are restored. Taken together, these results clearly indicate a central role for caveolin-1 in promoting cellular senescence and they suggest the hypothesis that premature senescence may represent a tumor suppressor function mediated by caveolin-1 in vivo.


Figures

Figure 1
Figure 1
Caveolin-1-overexpressing MEFs show premature irreversible growth arrest and senescence-like cell morphology. (A) MEFs derived from normal control mice and from caveolin-1 transgenic mice were passaged into a new 10-cm dish (1:3 division) every time they reached subconfluency. The number of passages MEFs were passaged before showing irreversible growth arrest was recorded. Note that overexpression of caveolin-1 induces premature growth arrest in MEFs. Values represent means ± SEM *P < 0.001. (B) Cells representative of the two MEF cell populations are shown (×60 magnification). (C) MEFs derived from normal control mice and from caveolin-1 transgenic mice were examined using a BX50WI Optical light microscope (Olympus) at a magnification of ×10. The percentage of cells showing senescence-like cell morphology was recorded. Note that 70 ± 5% of MEFs (passage 1) overexpressing caveolin-1 shows a large and flat morphology as compared with 15 ± 3% of MEFs derived from normal control mice. Values represent means ± SEM. *P < 0.0005.
Figure 2
Figure 2
Primary cultures of MEFs that transgenically express caveolin-1 show senescence-associated acid β-galactosidase activity. MEFs derived from normal control mice and from caveolin-1 transgenic mice were assayed for senescence-associated acid β-galactosidase activity (S-A β-gal). (A) Cells were examined using a BX50WI Optical light microscope (Olympus) at a magnification of ×10. A representative field is shown. (B) Quantitation of the senescence-associated acid β-galactosidase activity assay is shown. Note that 59 ± 6% of MEFs overexpressing caveolin-1 are positive for S-A β-gal as compared with only 12 ± 2% of MEFs expressing normal levels of endogenous caveolin-1. Values represent means ± SEM. *P < 0.0005.
Figure 3
Figure 3
Oxidative stress induces premature senescence in NIH 3T3 cells. NIH 3T3 cells were left untreated or treated with 150 μM H2O2 for 2 h and recovered for 11 d. (A) Cells representative of the two cell populations (untreated or H2O2-treated NIH 3T3 cells) were photographed at a magnification of ×60. (B) Cells were observed under a BX50WI Optical light microscope (Olympus) at a magnification of ×10. The percentage of cells showing a large and flat morphology was scored. Values represent means ± SEM. *P < 0.0005. (C) Untreated and H2O2-treated NIH 3T3 cells were subjected to senescence-associated β-galactosidase activity assay and were observed under a BX50WI Optical light microscope (Olympus) at a magnification of ×10. A representative field is shown. (D) Quantitation of the acid β-galactosidase activity assay shown in C. Note that the treatment with H2O2 successfully promotes premature senescence in NIH 3T3 cells. Values represent means ± SEM. *P < 0.0005.
Figure 4
Figure 4
SIPS is associated with up-regulation of caveolin-1. (A) NIH 3T3 cells were left untreated or treated for 2 h with the indicated concentration of H2O2 and were allowed to recover for 11 d. Cells were then subjected to immunoblot analysis with monospecific antibody probes that recognize only caveolin-1 (mAb 2297) or caveolin-2 (mAb 65). Note that the treatment with H2O2 (15–150 μM) induces up-regulation of endogenous caveolin-1, but not caveolin-2. Immunoblotting with anti-β-actin IgG served as a control for equal loading. (B) NIH 3T3 cells were left untreated or treated with 150 μM H2O2 for 2 h and were allowed to recover for the indicated period of time. Cells were then subjected to immunoblot analysis with monospecific antibody probes that recognize only caveolin-1 (mAb 2297) or caveolin-2 (mAb 65). Note that caveolin-1 protein expression is induced 3 d after the treatment with 150 μM H2O2 and remains elevated for up to 11 d. In contrast, caveolin-2 expression was not affected. Immunoblotting with anti-β-actin IgG served as a control for equal loading.
Figure 5
Figure 5
SIPS and caveolin-1 up-regulation are prevented by the treatment with the antioxidant quercetin. (A) β-galactosidase activity. NIH 3T3 cells were left untreated (CTL), treated with 150 μM H2O2 alone (H2O2) or in combination with 300 μM quercetin (H2O2 + quercetin), or treated with 300 μM quercetin alone (quercetin) for 2 h and the cells were allowed to recover for 11 d. Cells were then subjected to an acid β-galactosidase activity assay. In addition, NIH 3T3 cells were treated with 150 μM H2O2 alone for 2 h, recovered for 11 d, and then incubated with 300 μM quercetin for 2 h before assaying for acid β-galactosidase activity (H2O2 + quercetin*). Cells were photographed using a BX50WI Optical light microscope (Olympus) at a magnification of ×10. Note that treatment with quercetin completely prevented the induction of senescence-associated β-galactosidase activity in H2O2-treated cells. (B) Immunoblotting. Cells were treated as in A. Cell lysates were then prepared and subjected to SDS-PAGE/Western-blot analysis with anti-caveolin-1 and anti-caveolin-2 mAb probes. Interestingly, the antioxidant quercetin abolished the up-regulation of caveolin-1 protein expression induced by H2O2. Immunoblotting with anti-β-actin shows equal protein loading. (C) Immunoblotting. Cells were left untreated or treated with 300 μM quercetin for 2 h and were allowed to recover for the indicated period of time. Cells were then subjected to immunoblot analysis with monospecific antibody probes that recognize only caveolin-1 (mAb 2297) or caveolin-2 (mAb 65). Note that caveolin-1 protein expression was not affected after 3 d of recovery, but was down-regulated 11 d after the treatment. Interestingly, caveolin-2 protein expression was similarly affected. Immunoblotting with anti-β-actin was performed to show equal protein loading in all lanes.
Figure 5
Figure 5
SIPS and caveolin-1 up-regulation are prevented by the treatment with the antioxidant quercetin. (A) β-galactosidase activity. NIH 3T3 cells were left untreated (CTL), treated with 150 μM H2O2 alone (H2O2) or in combination with 300 μM quercetin (H2O2 + quercetin), or treated with 300 μM quercetin alone (quercetin) for 2 h and the cells were allowed to recover for 11 d. Cells were then subjected to an acid β-galactosidase activity assay. In addition, NIH 3T3 cells were treated with 150 μM H2O2 alone for 2 h, recovered for 11 d, and then incubated with 300 μM quercetin for 2 h before assaying for acid β-galactosidase activity (H2O2 + quercetin*). Cells were photographed using a BX50WI Optical light microscope (Olympus) at a magnification of ×10. Note that treatment with quercetin completely prevented the induction of senescence-associated β-galactosidase activity in H2O2-treated cells. (B) Immunoblotting. Cells were treated as in A. Cell lysates were then prepared and subjected to SDS-PAGE/Western-blot analysis with anti-caveolin-1 and anti-caveolin-2 mAb probes. Interestingly, the antioxidant quercetin abolished the up-regulation of caveolin-1 protein expression induced by H2O2. Immunoblotting with anti-β-actin shows equal protein loading. (C) Immunoblotting. Cells were left untreated or treated with 300 μM quercetin for 2 h and were allowed to recover for the indicated period of time. Cells were then subjected to immunoblot analysis with monospecific antibody probes that recognize only caveolin-1 (mAb 2297) or caveolin-2 (mAb 65). Note that caveolin-1 protein expression was not affected after 3 d of recovery, but was down-regulated 11 d after the treatment. Interestingly, caveolin-2 protein expression was similarly affected. Immunoblotting with anti-β-actin was performed to show equal protein loading in all lanes.
Figure 6
Figure 6
Quercetin's effects can be replicated by the antioxidant vitamin E. (A) β-galactosidase activity. NIH 3T3 cells were left untreated (CTL), treated with 150 μM H2O2 alone (H2O2) or in combination with 300 μM vitamin E (H2O2 + vitamin E), or treated with 300 μM vitamin E alone (vitamin E) for 2 h and the cells were allowed to recover for 11 d. Cells were then subjected to an acid β-galactosidase activity assay. In addition, NIH 3T3 cells were treated with 150 μM H2O2 alone for 2 h, recovered for 11 d, and then incubated with 300 μM vitamin E for 2 h before assaying for acid β-galactosidase activity (H2O2 + vitamin E*). Cells were photographed using a BX50WI Optical light microscope (Olympus) at a magnification of ×10. Interestingly, vitamin E completely prevented the induction of senescence-associated β-galactosidase activity in H2O2-treated cells. As a control, treatment with vitamin E alone did not stimulate acid β-galactosidase activity. (B) Immunoblotting. Cells were treated as in A. Cell lysates were then prepared and subjected to SDS-PAGE/Western-blot analysis with anti-caveolin-1 and anti-caveolin-2 mAb probes. Interestingly, the antioxidant vitamin E abolished the up-regulation of caveolin-1 protein expression induced by H2O2. Caveolin-2 protein expression was not significantly affected by the treatment with H2O2 alone and was slightly reduced, similar to caveolin-1, by the treatment of H2O2 in combination with vitamin E. Immunoblotting with anti-β-actin shows equal protein loading.
Figure 7
Figure 7
The antioxidant quercetin totally prevents the stimulation of the caveolin-1 promoter activity, but only partially abrogates the activation of the p53-responsive element induced by H2O2. NIH 3T3 cells were transiently transfected with 2 μg of the caveolin-1 promoter luciferase reporter (3 Kb + Intron-1; A) or with the luciferase reporter plasmid pTA-p53RE (B). Six hours post-transfection, cells were rinsed with PBS and incubated in medium containing 150 μM H2O2 with or without 300 μM quercetin for 2 h. Cells were washed in complete medium and were incubated at 37°C for an additional 72 h. Cells were then lysed and the luciferase activity was measured. Note that H2O2 stimulates the caveolin-1 promoter activity (A) and the p53 responsive element (B). Importantly, quercetin completely abolished the stimulation of the caveolin-1 promoter activity induced by H2O2, but only partially inhibited the activation of the p53-responsive element. Values represent means ± SEM (n = 9 for each experimental point). *P < 0.001; **P < 0.0005.
Figure 8
Figure 8
Down-regulation of caveolin-1 protein expression confers resistance to SIPS. (A) Immunoblotting. Normal NIH 3T3 cells, Cav-1-AS cells, and Rev-Cav-1-AS cells were subjected to Western-blot analysis using a mAb probe specific for caveolin-1. Note that caveolin-1 expression is significantly reduced in Cav-1-AS cells. Immunoblotting with anti-β-actin antibody shows equal protein loading. (B) β-galactosidase activity. Normal NIH 3T3 cells, Cav-1-AS cells, and Rev-Cav-1-AS cells were left untreated or treated with 150 μM H2O2 for 2 h and were allowed to recover for 11 d. Cells were then observed under a BX50WI Optical light microscope (Olympus; ×10 magnification) and the percentage of cells positive for senescence-associated acid β-galactosidase activity was recorded. Note that cells expressing low levels of caveolin-1 display a dramatically reduced number of acid β-galactosidase activity-positive cells. Values represent means ± SEM. *P < 0.0005. (C) Immunoblotting. Cells were treated as in B. Cell lysates were then subjected to SDS-PAGE/Western-blot analysis with a mAb probe specific for caveolin-1. Interestingly, H2O2 promoted up-regulation of endogenous caveolin-1 only in normal NIH 3T3 cells and in Rev-Cav-1-AS cells. Immunoblotting with anti-β-actin IgG served as a control for equal protein loading.
Figure 9
Figure 9
Oxidative stress promotes apoptosis in cells with low caveolin-1 protein expression. (A) Cell death. Normal NIH 3T3 cells, Cav-1-AS cells, and Rev-Cav-1-AS cells were treated with 150 μM H2O2 for 2 h and the cells were allowed to recover for the indicated period of time. The cells remaining in the dish were then collected and counted. Interestingly, H2O2 induces a significantly higher degree of cell death in the Cav-1-AS cells (i.e., that express low levels of caveolin-1). Values represent means ± SEM (n = 8 for each experimental point). *P < 0.001. (B) Cell morphology. Cells were left untreated or treated as in A and allowed to recover for 12 h. Cells were then observed under a BX50WI Optical light microscope (Olympus; ×10 magnification). Note that Cav-1-AS cells clearly show cell shrinkage when stimulated with H2O2. (C) Nuclear morphology. Cells were left untreated or treated as in B, stained with DAPI to visualize their nuclear morphology, and then observed under a Provis fluorescence microscope (Olympus). Note that nuclear condensation is observed only in Cav-1-AS cells.
Figure 9
Figure 9
Oxidative stress promotes apoptosis in cells with low caveolin-1 protein expression. (A) Cell death. Normal NIH 3T3 cells, Cav-1-AS cells, and Rev-Cav-1-AS cells were treated with 150 μM H2O2 for 2 h and the cells were allowed to recover for the indicated period of time. The cells remaining in the dish were then collected and counted. Interestingly, H2O2 induces a significantly higher degree of cell death in the Cav-1-AS cells (i.e., that express low levels of caveolin-1). Values represent means ± SEM (n = 8 for each experimental point). *P < 0.001. (B) Cell morphology. Cells were left untreated or treated as in A and allowed to recover for 12 h. Cells were then observed under a BX50WI Optical light microscope (Olympus; ×10 magnification). Note that Cav-1-AS cells clearly show cell shrinkage when stimulated with H2O2. (C) Nuclear morphology. Cells were left untreated or treated as in B, stained with DAPI to visualize their nuclear morphology, and then observed under a Provis fluorescence microscope (Olympus). Note that nuclear condensation is observed only in Cav-1-AS cells.
Figure 10
Figure 10
UV-C light treatment induces the up-regulation of caveolin-1 protein expression. NIH 3T3 cells were left untreated or treated with subLDs of UV-C light (10 J/m2) and were allowed to recover for the indicated period of time. Cells were then subjected to immunoblotting with monospecific antibody probes that recognize only caveolin-1 (mAb 2297) or caveolin-2 (mAb 65). Note that 6 d after stimulation with subLDs of UV-C light, caveolin-1 protein expression is up-regulated. Caveolin-1 expression remains elevated up to 11 d. In contrast, caveolin-2 protein expression was not affected by UV irradiation. Immunoblotting with anti-β-actin IgG shows equal protein loading.

Similar articles

Cited by

References

    1. Amundson SA, Myers TG, Fornace AJ., Jr Roles for p53 in growth arrest and apoptosis: putting on the brakes after genotoxic stress. Oncogene. 1998;17:3287–3299. - PubMed
    1. Bates S, Vousden KH. Mechanisms of p53-mediated apoptosis. Cell Mol Life Sci. 1999;55:28–37. - PMC - PubMed
    1. Bayreuther K, Rodemann HP, Hommel R, Dittmann K, Albiez M, Francz PI. Human skin fibroblasts in vitro differentiate along a terminal cell lineage. Proc Natl Acad Sci USA. 1988;85:5112–5116. - PMC - PubMed
    1. Black EJ, Clark W, Gillespie DA. Transient deactivation of ERK signaling is sufficient for stable entry into G0 in primary avian fibroblasts. Curr Biol. 2000;10:1119–1122. - PubMed
    1. Bumann J, Santo-Holtje L, Loffler H, Bamberg M, Rodemann HP. Radiation-induced alterations of the proliferation dynamics of human skin fibroblasts after repeated irradiation in the subtherapeutic dose range. Strahlenther Onkol. 1995;171:35–41. - PubMed

Publication types

MeSH terms