. 2002 Jul 22;158(2):293-303.
doi: 10.1083/jcb.200202058. Epub 2002 Jul 22.

Role of KIFC3 motor protein in Golgi positioning and integration

Affiliations

Role of KIFC3 motor protein in Golgi positioning and integration

Ying Xu et al. J Cell Biol. .

Abstract

KIFC3, a microtubule (MT) minus end-directed kinesin superfamily protein, is expressed abundantly and is associated with the Golgi apparatus in adrenocortical cells. We report here that disruption of the kifC3 gene induced fragmentation of the Golgi apparatus when cholesterol was depleted. Analysis of the reassembly process of the Golgi apparatus revealed bidirectional movement of the Golgi fragments in both wild-type and kifC3-/- cells. However, we observed a markedly reduced inwardly directed motility of the Golgi fragments in cholesterol-depleted kifC3-/- cells compared with either cholesterol-depleted wild-type cells or cholesterol-replenished kifC3-/- cells. These results suggest that (a) under the cholesterol-depleted condition, reduced inwardly directed motility of the Golgi apparatus results in the observed Golgi scattering phenotype in kifC3-/- cells, and (b) cholesterol is necessary for the Golgi fragments to attain sufficient inwardly directed motility by MT minus end-directed motors other than KIFC3, such as dynein, in kifC3-/- cells. Furthermore, we showed that Golgi scattering was much more drastic in kifC3-/- cells than in wild-type cells to the exogenous dynamitin expression even in the presence of cholesterol. These results collectively demonstrate that KIFC3 plays a complementary role in Golgi positioning and integration with cytoplasmic dynein.


Figures

Figure 1.
Figure 1.
Disruption of the mouse kifC3 gene. (A) Structures of wild-type kifC3 gene (top), targeting vector (IRES, internal ribosome entry site; LacZ, β galactosidase gene; neo, promoterless neomycin resistance gene; polyA, RNA polymerase II pausing signal) (middle), and mutant kifC3 gene after homologous recombination (bottom). Closed boxes, p−3, p−2, p−1, and p+1, respective exons around the p-loop. (B) Southern blot analysis of ES clones. Genomic DNA from ES cells was digested with HindIII and subjected to hybridization with the probe indicated in A. The knockout and wild-type alleles are detected as 7.2- and 2.6-kb bands, respectively (B, arrowheads). (C) PCR analysis of kifC3 gene using mouse tail genomic DNA. HR, homologous recombinant band; WT, wild-type band. Genotypes: +/+, wild type; +/−, heterozygote; −/−, homozygote. (D) Immunoblots of total kidney homogenate from wild-type and null mutant mice using anti-KIFC3 antibody. The lower band is a truncated form of KIFC3. The specific bands of KIFC3 (arrowheads) are not detected in kifC3 −/− kidney.
Figure 2.
Figure 2.
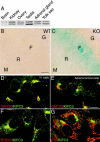
Localization of KIFC3. (A) Western blot analysis shows that KIFC3 is relatively abundant in the kidney, testis, adrenal gland, ovary, and yolk sac, but scanty in the brain. (B and C) A microscopic section of adrenal tissue stained against β-galactosidase. The adrenocortical area shows a strong signal of β-galactosidase. (B) Wild type; (C) knockout. G, zona glomerulosa; F, zona fasciculata; M, adrenal medulla; R, zona reticularis. Bar, 100 μm. Distribution of KIFC3 in Y1 cell line (D, E, and G) and primary adrenocortical cells (E). Merged image double-stained with anti-KIFC3 antibody (green) and antibodies (red) against GM130 (D and E), PDI ( F), or ERGIC (G). Bar, 10 μm.
Figure 3.
Figure 3.
Phenotype of Golgi apparatus in kifC3 / adrenocortical cells under cholesterol-depleted condition. (A and B) Golgi apparatus labeled with BODIPY-ceramide in LPDS medium. Golgi apparatus is stained as a compact perinuclear structure in wild-type cells (A), whereas it is fragmented around the nucleus in kifC3 −/− cells (B). (C) Cholesterol-deprived kifC3 −/− cells were replenished with cholesterol. The dispersed Golgi apparatus in kifC3 −/− cells recovers its compact arrangement. (D–G) Filipin staining of adrenocortical cells grown in the presence (D and E) or absence of cholesterol (F and G). (D and F) Wild-type; (E and G) knockout. Cholesterol is completely depleted by treatment with LPDS. Bars, 10 μm. (H) Histogram of the scattering degree of Golgi fragments in 100 wild-type (open bars) and 100 kifC3 −/− cells (solid bars). The distribution of the Golgi fragments in kifC3 −/− cells is shifted to the higher scores (p < 0.01), indicating the dispersion of the Golgi apparatus in kifC3 −/−cells. (I) Comparison of the viability between wild-type and kifC3 −/− cells in FCS and LPDS media after 72 h. Left and right panels display cells grown in the cholesterol+ and cholesterol medium, respectively, showing the lower viability of kifC3 −/− cells in the latter medium. (J) Western blotting by anti-PARP antibody in wild-type and kifC3 −/− cells cultured in LPDS medium for the indicated hours. Caspase-cleaved product (85 kD) shown in control apoptotic cells induced by TNF, was not detected in both cells grown in LPDS medium.
Figure 4.
Figure 4.
Structure of the Golgi apparatus under cholesterol-depleted condition. (A–F) Micrographs of the Golgi apparatus stained by antibodies against three different Golgi regions. β-COP (A and B), mannosidase II (C and D), Rab6 (E and F). (G and H) Adrenocortical cells expressing TGN38–GFP. All these proteins lose their juxtanuclear localization in kifC3 −/− cells (B, D, F, and H) compared with those in wild-type cells (A, C, E, and G). Bar, 10 μm. (I–K) Electron micrographs of Golgi apparatus in wild-type (I) and kifC3 −/− (J and K) cells after cholesterol deprivation. Arrowheads indicate the Golgi apparatus. Bar, 1 μm. (K) At higher magnification, a Golgi fragment clearly consists of several cisternal stacks in kifC3 −/− cells. Bar, 500 nm. (L and M) Fluorescence recovery of BODIPY-ceramide after photobleaching of Golgi membranes followed by imaging at the times indicated. Note that fluorescence was recovered in the prebleached region in wild-type cells (L), but not in kifC3 −/− cells (M), indicating that these fragments in kifC3 −/− cells are discontinuous. Bar, 10 μm.
Figure 5.
Figure 5.
Dynamics of Golgi fragments in wild-type and kifC3 / cells after nocodazole removal under cholesterol-depleted condition. (A–D) Distribution of MTs in wild-type (A) and kifC3 −/− (B–D) cells stained by anti–α-tubulin antibody. The patterns of MTs are similar in both cells without treatment (A and B). Dispersed MTs after nocodazole removal (0 min; C) recovered within 30 min (D). (E and F) Time-lapse image of the Golgi apparatus in wild-type (E) and kifC3 −/− (F) cells after nocodazole washout. Right panels show several accumulated Golgi fragment tracks from start to end in wild-type (upper) and kifC3 −/− (lower) cells (see Videos 1 and 2, available at http://www.jcb.org/cgi/content/full/jcb.200202058/DC1). Bars, 10 μm. (G) Quantitative analysis of assembly movement of Golgi fragments in the presence and absence of cholesterol after nocodazole washout. The proportion of outwardly directed movements, stop, and inwardly directed movements of Golgi fragments was evaluated for each fluorescent spot after nocodazole washout in the cholesterol+ and cholesterol medium in wild-type (WT) and kifC3 −/− (KO) cells, respectively. Each column shows the average proportion of 100 spots in 10 cells of each group. The degree of inwardly directed motility is markedly reduced in kifC3 −/− cells only in the cholesterol medium (p < 0.01). (H and I) The kinetics of reassembly of the Golgi apparatus in the absence (H) and presence (I) of cholesterol medium. The number of fragments per cell was defined by counting spots that contained more than four pixels in size. The y axis shows percentage of the total numbers of Golgi fragments at their respective time divided by the number of the Golgi fragments after nocodazole washout at 0 min.
Figure 6.
Figure 6.
Time-lapse images of recovery of the Golgi apparatus after BFA treatment under cholesterol-depleted condition. (A and B) Representative time-lapse images from 0 to 70 min. The Golgi apparatus is distributed homogeneously throughout the cytoplasm after BFA treatment in wild-type (0') and kifC3 −/− (0') cells. After 70 min of incubation without BFA, almost all the fragments concentrated near the MTOC in wild-type cells (top row), whereas many smaller Golgi fragments were still dispersed in the cytoplasm in kifC3 −/− cells (bottom row). The time-lapse videos are available at http://www.jcb.org/cgi/content/full/jcb.200202058/DC1 (Videos 3 and 4). Bar, 10 μm.
Figure 7.
Figure 7.
Recovery of the Golgi apparatus after nocodazole treatment under subacute cholesterol-depleted condition. After a 120-min incubation with methyl β-cyclodextrin in the LPDS medium, followed by nocodazole treatment, the Golgi apparatus is diffusely distributed in both wild-type (A) and kifC3 −/− (C) cells. At 120' after nocodazole washout, compact Golgi apparatus appeared in wild-type cells (B), whereas a fragmented one was observed in kifC3 −/− cells (D).
Figure 8.
Figure 8.
Recovery process after BFA washout in the presence of cytochalasin D under cholesterol-depleted condition. The recovery processes of the Golgi apparatus labeled with BODYPY-ceramide after BFA treatment were observed in wild-type (A and B) and kifC3 −/− (C and D) cells in the presence of 1 μM cytochalasin D. The images were recorded at the indicated times after BFA removal, showing no change compared with those without cytochalasin D (Fig. 6).
Figure 9.
Figure 9.
ER-to-Golgi transport of VSVG–GFP in wild-type and kifC3 / cells under cholesterol-depleted condition. (A–D) ER-to-Golgi transport of VSVG–GFP in wild-type (A and B) and kifC3 −/− (C and D) cells. Wild-type and kifC3 −/− cells expressing VSVG–GFP were incubated at 39.5°C for 6 h (A and C), and then the temperature was shifted to 30°C for 5 min (B and D) in LPDS medium. Note that VSVG accumulated in the corresponding Golgi apparatus area within 5 min in kifC3 −/− cells as efficiently as in wild-type cells, although the Golgi apparatus was dispersed in kifC3 −/− cells. Video images are available online (Videos 5 and 6). (E–H) Reorganization of the Golgi apparatus in VSVG–GFP-expressing wild-type (E and F) and kifC3 −/− (G and H) cells in the presence of nocodazole. The images were recorded at the indicated times after the temperature shift from 39.5°C to 30°C. The patterns of VSVG–GFP distribution were similar in wild-type (F) and kifC3 −/− (H) cells, but were more scattered than that in kifC3 −/− cells without nocodazole (D), indicating that ER-to-Golgi transport is MT dependent but not coincident with the KIFC3-dependent process. Bar, 10 μm. (I and J) Immunostaining of wild-type (I) and kifC3 −/− (J) cells with anti-GM130 antibody after treatment with BFA under the cholesterol-depleted condition. The distribution of ER exits did not change between the two groups. (K and L) Kinetics of VSVG transport from the ER to the Golgi apparatus in wild-type (I) and kifC3 −/− (J) cells. Fluorescence intensity in the Golgi apparatus (solid line) and that in the cytoplasm excluding Golgi region (dotted line) were quantified at the indicated times in wild-type (K) and kifC3 −/− (L) cells. No difference is observed between the two groups.
Figure 10.
Figure 10.
Effects of dynamitin overexpression on the structure of the Golgi apparatus in wild-type and kifC3 / cells. Wild-type (A, C, and E) and kifC3 −/− (B, D, and F) cells were observed at 0' (A and B), 6 h (C and D), and 12 h (E and F) after the infection of adenovirus expressing dynamitin–CFP in FCS medium. The Golgi apparatus was labeled with BODIPY-ceramide at the indicated times. Dynamitin overexpression caused the dispersion of Golgi apparatus after a 12-h infection in both wild-type (E) and kifC3 −/− (F) cells. After a 6-h infection, overexpression of dynamitin affected the Golgi apparatus more severely in kifC3 −/− cells (D) than in wild-type cells (C). Bar, 10 μm. (G) Time course of the percentage of cells with dispersed Golgi pattern in wild-type (solid line) and kifC3 −/− (dotted line) cells in cholesterol+ medium and wild-type cells in cholesterol medium (broken line). (H and I) Histogram of the percentage of cells with dispersed (solid box) or compact (open box) Golgi apparatus is shown according to the fluorescence intensity of CFP–dynamitin after a 6-h infection (H, wild-type; I, kifC3 −/− cells). Note that kifC3 −/− cells are more susceptible to the intermediate level of dynamitin–CFP expression (30–60 U) than wild-type cells. (J) Subcellular fraction of CyDy in Y1 cells grown in cholesterol (lanes 1 and 3) or cholesterol+ (lanes 2 and 4) medium. No change is detected in the amount of soluble (lanes 1 and 2) as well as membrane-bound CyDy (lanes 3 and 4). (K) Immunoblot of CyDy and KIFC3 in detergent-extracted fraction of Y1 cells cultured in cholesterol+ or cholesterol medium. CyDy and KIFC3 were immunoprecipitated from fractions successively extracted by 0.02% saponin and 1% Triton X-100. CyDy in the Triton X-100–extracted fraction decreased in cholesterol medium, whereas KIFC3 did not change.

Similar articles

Cited by

References

    1. Allan, V.J., and T.A. Schroer. 1999. Membrane motors. Curr. Opin. Cell Biol. 11:476–482. - PubMed
    1. Burkhardt, J.K., C.J. Echeverri, T. Nilsson, and R.B. Vallee. 1997. Overexpression of the dynamitin (p50) subunit of the dynactin complex disrupts dynein-dependent maintenance of membrane organelle distribution. J. Cell Biol. 139:469–484. - PMC - PubMed
    1. Cole, N.B., N. Sciaky, A. Marotta, J. Song, and J. Lippincott-Schwartz. 1996. Golgi dispersal during microtubule disruption: regeneration of Golgi stacks at peripheral endoplasmic reticulum exit sites. Mol. Biol. Cell. 7:631–650. - PMC - PubMed
    1. De Camilli, P., S.D. Emr, P.S. McPherson, and P. Novick. 1996. Phosphoinositides as regulators in membrane traffic. Science. 271:1533–1539. - PubMed
    1. Echard, A., F. Jollivet, O. Martinez, J.J. Lacapere, A. Rousselet, I. Janoueix-Lerosey, and B. Goud. 1998. Interaction of a Golgi-associated kinesin-like protein with Rab6. Science. 279:580–585. - PubMed

Publication types