Comparative Study
. 2002 Jul 15;30(14):3214-24.
doi: 10.1093/nar/gkf438.

Statistical significance of clusters of motifs represented by position specific scoring matrices in nucleotide sequences

Affiliations
Comparative Study

Statistical significance of clusters of motifs represented by position specific scoring matrices in nucleotide sequences

Martin C Frith et al. Nucleic Acids Res. .

Abstract

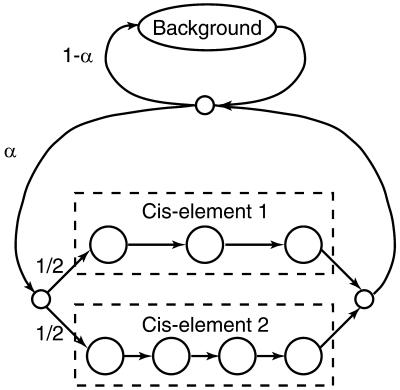
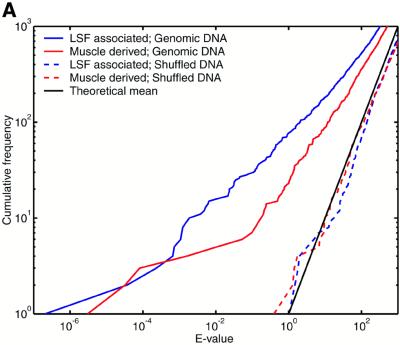
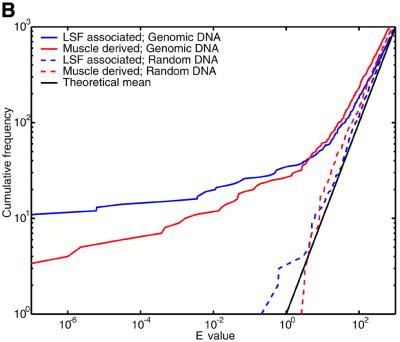
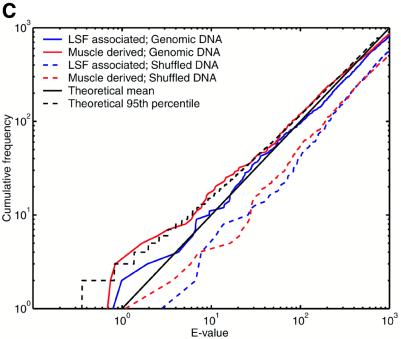
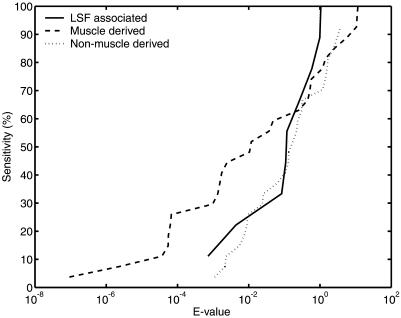
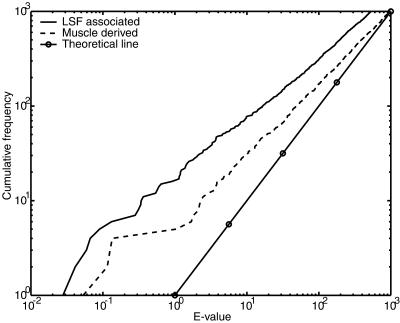
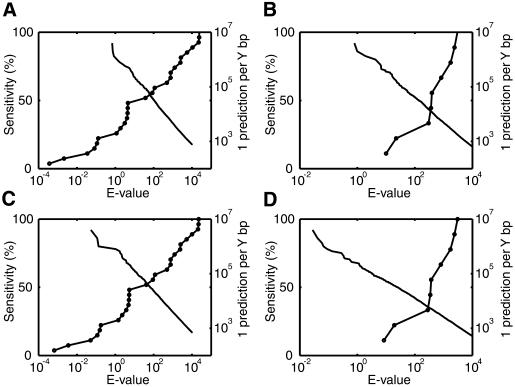
The human genome encodes the transcriptional control of its genes in clusters of cis-elements that constitute enhancers, silencers and promoter signals. The sequence motifs of individual cis- elements are usually too short and degenerate for confident detection. In most cases, the requirements for organization of cis-elements within these clusters are poorly understood. Therefore, we have developed a general method to detect local concentrations of cis-element motifs, using predetermined matrix representations of the cis-elements, and calculate the statistical significance of these motif clusters. The statistical significance calculation is highly accurate not only for idealized, pseudorandom DNA, but also for real human DNA. We use our method 'cluster of motifs E-value tool' (COMET) to make novel predictions concerning the regulation of genes by transcription factors associated with muscle. COMET performs comparably with two alternative state-of-the-art techniques, which are more complex and lack E-value calculations. Our statistical method enables us to clarify the major bottleneck in the hard problem of detecting cis-regulatory regions, which is that many known enhancers do not contain very significant clusters of the motif types that we search for. Thus, discovery of additional signals that belong to these regulatory regions will be the key to future progress.


Figures

Figure 1
Figure 1
A hidden Markov model of cis-element clusters. The large circles represent states that emit single nucleotides. The small circles represent silent states that do not emit, and the arrows represent allowed transitions between states. The cis-element states emit nucleotides with probabilities obtained from the count matrix for this cis-element. The background state emits nucleotides with background probabilities. Non-palindromic cis- elements are duplicated so that they are represented once on each strand.
Figure 2
Figure 2
Motif clusters found by COMET in natural and synthetic sequence sets, using three different null models. Either of two motif sets was searched for: muscle derived and LSF associated (see text for details). The y-axis indicates the number of clusters found with E-value lower than the value indicated on the x-axis. (A) Null model = independent nucleotides with frequencies estimated from each query sequence. (B) Null model = fifth order Markov. (C) Null model = independent nucleotides with frequencies estimated from a sliding window. The theoretical lines indicate the mean and 95th percentile for the number of observations at each E-value, according to a Poisson distribution.
Figure 2
Figure 2
Motif clusters found by COMET in natural and synthetic sequence sets, using three different null models. Either of two motif sets was searched for: muscle derived and LSF associated (see text for details). The y-axis indicates the number of clusters found with E-value lower than the value indicated on the x-axis. (A) Null model = independent nucleotides with frequencies estimated from each query sequence. (B) Null model = fifth order Markov. (C) Null model = independent nucleotides with frequencies estimated from a sliding window. The theoretical lines indicate the mean and 95th percentile for the number of observations at each E-value, according to a Poisson distribution.
Figure 3
Figure 3
E-values of motif clusters found by COMET in known regulatory regions. COMET was used to find clusters of LSF associated motifs in LSF regulatory regions (solid line), and clusters of muscle derived (dashed line) and non-muscle derived motifs (dotted line) in muscle regulatory regions. The y-axis indicates the proportion of regulatory regions that contain a motif cluster with E-value lower than that indicated on the x-axis.
Figure 4
Figure 4
Cumulative frequency plots of motif cluster E-values found by COMET in promoter sequences. COMET was used to find clusters of LSF associated motifs (solid line without circles) or muscle derived motifs (dashed line) in a set of promoter sequences. The y-axis indicates the number of clusters with E-value lower than that indicated on the x-axis. The theoretically expected line is marked with circles.
Figure 5
Figure 5
Plots of trade-off between sensitivity and background prediction rate for finding motif clusters, as the E-value threshold is varied. The line marked with circles indicates the proportion of true regulatory regions identified by COMET at different E-value thresholds. The unmarked line describes the background prediction rate, in terms of the average number of base pairs between predictions, on a control sequence set over the same range of E-values. (A) Sensitivity for muscle regulatory regions versus prediction rate for genomic sequences, using muscle derived motifs. (B) Sensitivity for LSF regulatory regions versus prediction rate for genomic sequences, using LSF associated motifs. (C) Sensitivity for muscle regulatory regions versus prediction rate for promoter sequences, using muscle derived motifs. (D) Sensitivity for LSF regulatory regions versus prediction rate for promoter sequences, using LSF associated motifs.

Similar articles

Cited by

References

    1. Lander E.S., Linton,L.M., Birren,B., Nusbaum,C., Zody,M.C., Baldwin,J., Devon,K., Dewar,K., Doyle,M., FitzHugh,W. et al. (2001) Initial sequencing and analysis of the human genome. Nature, 409, 860–921. - PubMed
    1. Claverie J.M., (2000) From bioinformatics to computational biology. Genome Res., 10, 1277–1279. - PubMed
    1. Arnone M.I., and Davidson,E.H. (1997) The hardwiring of development: organization and function of genomic regulatory systems. Development, 124, 1851–1864. - PubMed
    1. Graber J.H., Cantor,C.R., Mohr,S.C. and Smith,T.F. (1999) In silico detection of control signals: mRNA 3′-end-processing sequences in diverse species. Proc. Natl Acad. Sci. USA, 96, 14055–14060. - PMC - PubMed
    1. Deshler J.O., Highett,M.I. and Schnapp,B.J. (1997) Localization of Xenopus Vg1 mRNA by Vera protein and the endoplasmic reticulum. Science, 276, 1128–1131. - PubMed

Publication types

MeSH terms