. 2002 Aug 6;99(16):10695-9.
doi: 10.1073/pnas.152346899. Epub 2002 Jul 22.

Altered glycan-dependent signaling induces insulin resistance and hyperleptinemia

Affiliations

Altered glycan-dependent signaling induces insulin resistance and hyperleptinemia

Donald A McClain et al. Proc Natl Acad Sci U S A. .

Abstract

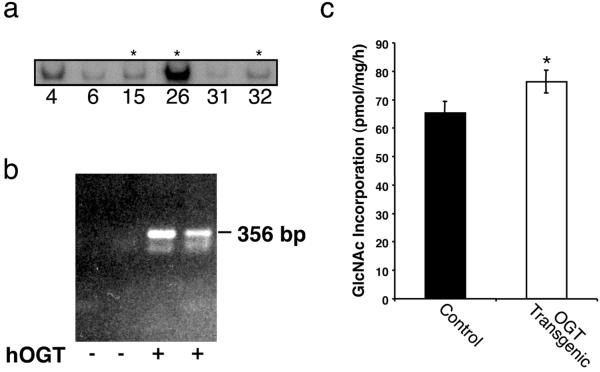
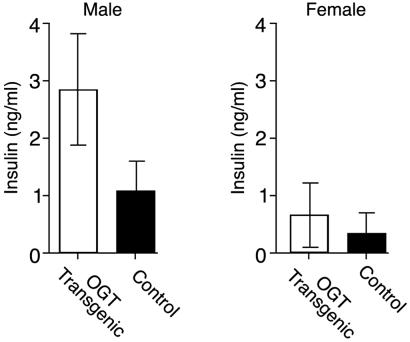
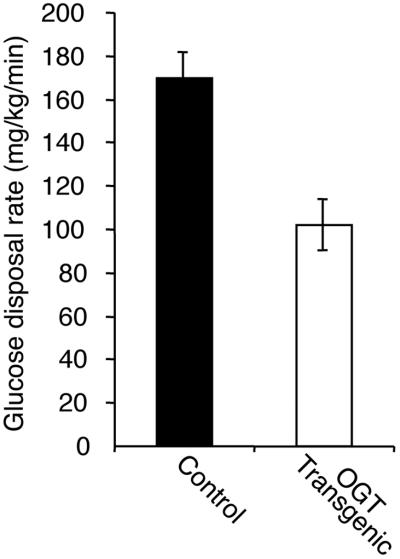
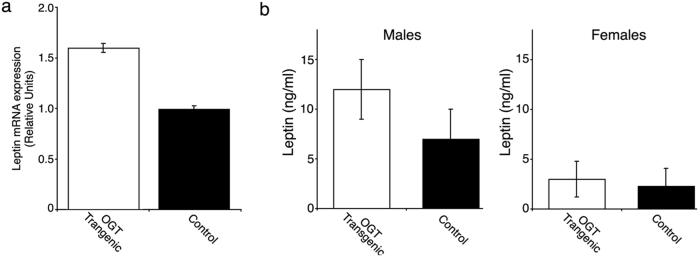
Insulin resistance and beta cell toxicity are key features of type 2 diabetes. One leading hypothesis suggests that these abnormalities result from excessive flux of nutrients through the UDP-hexosamine biosynthetic pathway leading to "glucose toxicity." How the products of the hexosamine pathway mediate these effects is not known. Here, we show that transgenic overexpression of an enzyme using UDP-GlcNAc to modify proteins with O-GlcNAc produces the type 2 diabetic phenotype. Even modest overexpression of an isoform of O-GlcNAc transferase, in muscle and fat, leads to insulin resistance and hyperleptinemia. These data support the proposal that O-linked GlcNAc transferase participates in a hexosamine-dependent signaling pathway that is linked to insulin resistance and leptin production.


Figures

Fig 1.
Fig 1.
OGT expression in control and transgenic mice. (a) Southern analysis of OGT transgenics (asterisks indicate three of the transgenic lines chosen for subsequent analysis). Isolated DNA from the founder mice was probed with an [α-32P]-labeled DNA fragment corresponding to 2.8 kb of the OGT coding region. (b) Presence of OGT cDNA products after RT-PCR of muscle and fat tissue. Quantification of human OGT mRNA transgene expression in muscle (lane 3) and fat (lane 4) was perfomed by RT-PCR. Lanes 1 and 2 represent control animals containing no transgene. (c) OGT activity in muscle of control and transgenic mice. Muscle from control and transgenic littermates was assayed for OGT activity by using casein kinase II as an acceptor peptide and measuring GlcNAc incorporation. (P < 0.05).
Fig 2.
Fig 2.
Insulin levels in random-fed control and OGT transgenic mice. Insulin levels were measured in over 100 control and transgenic littermates. Measurements were performed by using a rat insulin RIA. Differences between serum insulin levels were statistically significant (P < 0.02).
Fig 3.
Fig 3.
Glucose disposal rates assessed by the hyperinsulinemic–euglycemic clamp technique. Transgenic (n = 4) and control (n = 5) male mice were infused with maximally active insulin concentrations and their glucose disposal rates determined (P < 0.01, control vs. transgenic). Weights of the mice in the two groups were equivalent (control 24.6 ± 2.1 g, transgenic 25.4 ± 3.0 g).
Fig 4.
Fig 4.
Leptin mRNA (a) and protein (b) levels in control and OGT mice. (a) Leptin mRNA was quantified by using total RNA from fat pads from three wild type and four transgenic, random-fed, male mice. Shown are means ± SE. from duplicate determinations from each mouse (P < 0.0005). (b) Serum leptin levels were assayed by RIA as described in Methods.

References

    1. Kahn B. B. & Flier, J. S. (2000) J. Clin. Invest. 106, 473-481. - PMC - PubMed
    1. Kruszynska Y. T. & Olefsky, J. M. (1996) J. Invest. Med. 44, 413-428. - PubMed
    1. Rossetti L., Giaccari, A. & DeFronzo, R. A. (1990) Diabetes Care 13, 610-630. - PubMed
    1. McClain D. A. & Crook, E. D. (1996) Diabetes 45, 1003-1009. - PubMed
    1. Rossetti L. (2000) Endocrinology 141, 1922-1925. - PubMed

Publication types

MeSH terms