. 2002 Jul 23:2:20.
doi: 10.1186/1471-2180-2-20.

Epstein-Barr virus reactivation after superinfection of the BJAB-B1 and P3HR-1 cell lines with cytomegalovirus

Affiliations

Epstein-Barr virus reactivation after superinfection of the BJAB-B1 and P3HR-1 cell lines with cytomegalovirus

Rodney Arcenas et al. BMC Microbiol. .

Abstract

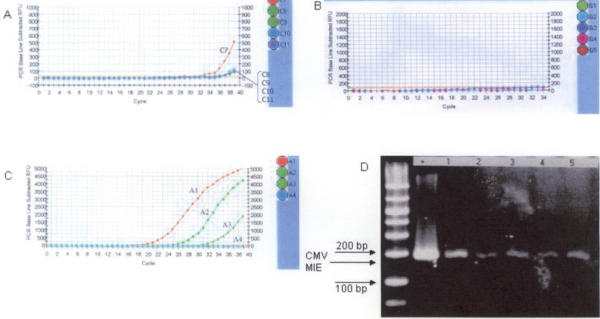
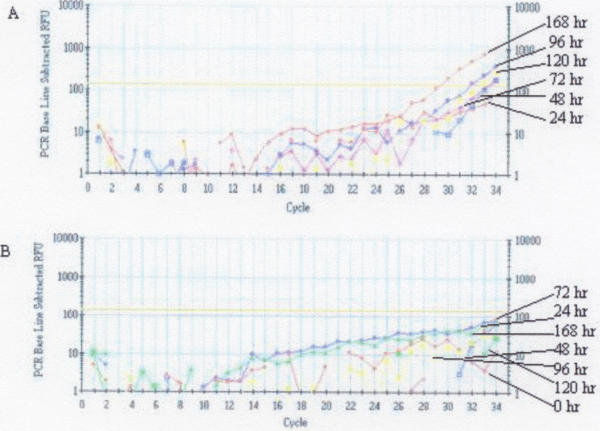
Background: Studies examining herpesvirus-herpesvirus (cytomegalovirus (CMV)-Epstein-Barr virus (EBV)) interactions are limited, and many of the studies have been clinical observations suggesting such an interaction exists. This report aims to examine the in vitro susceptibilities of BJAB-B1 and P3HR-1 cells (EBV positive Burkitt's lymphoma B-cell lines) to a CMV superinfection; and show that EBV reactivation occurs after CMV superinfects these cell lines.

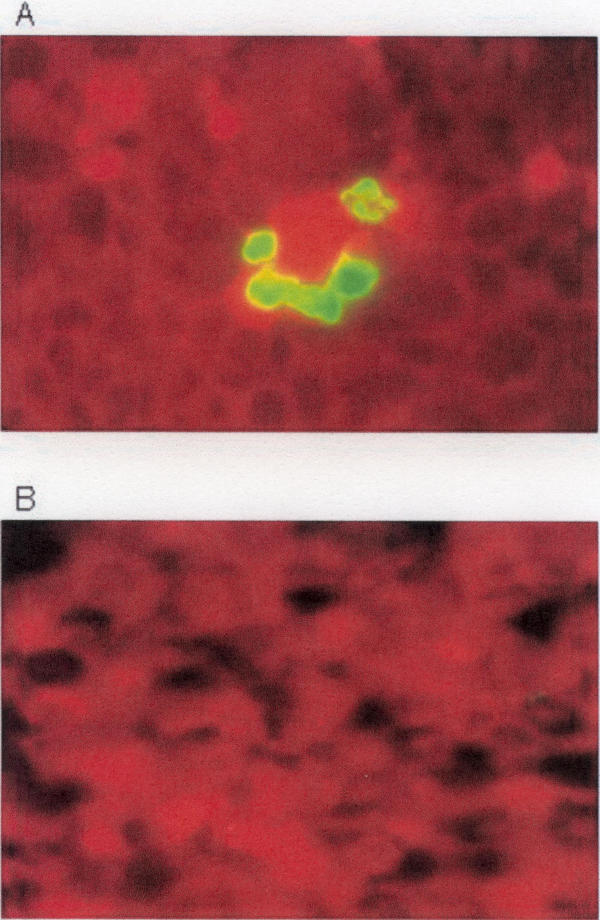
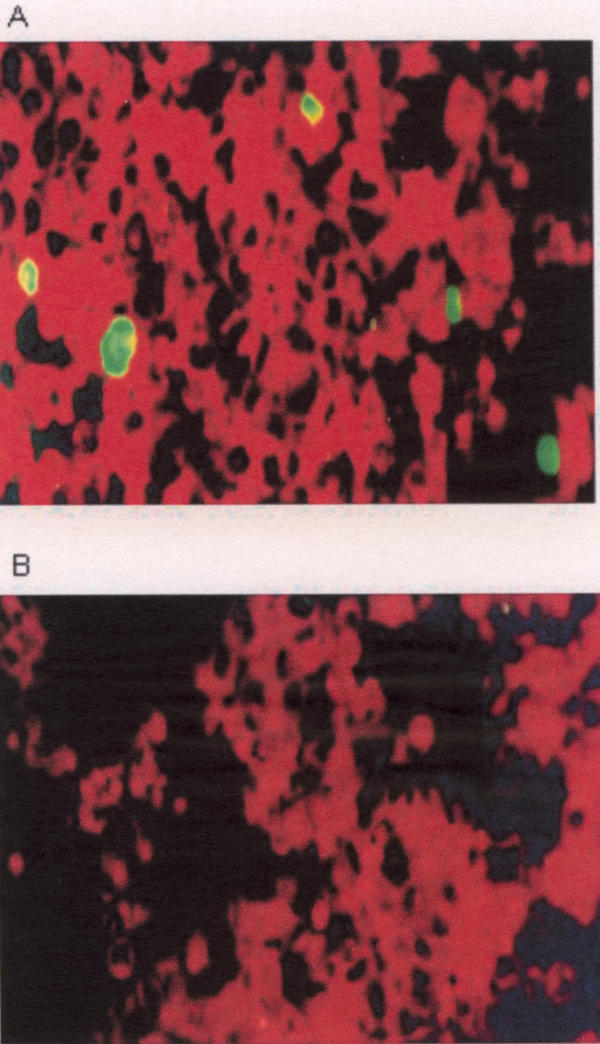
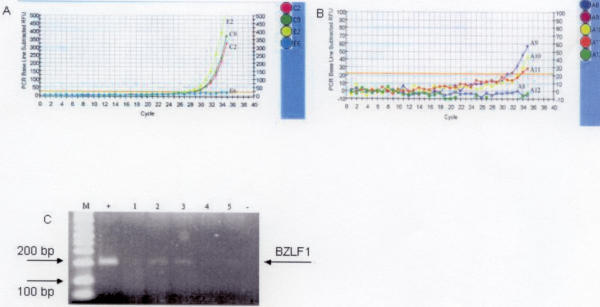
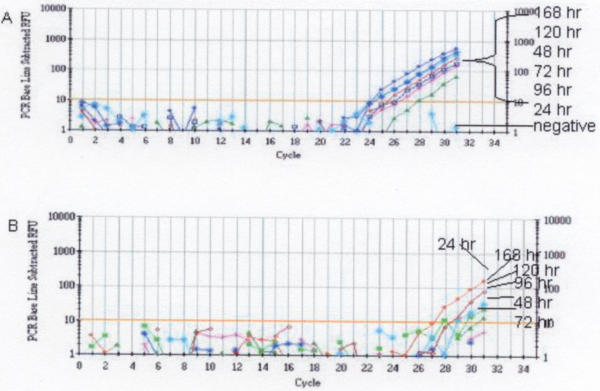
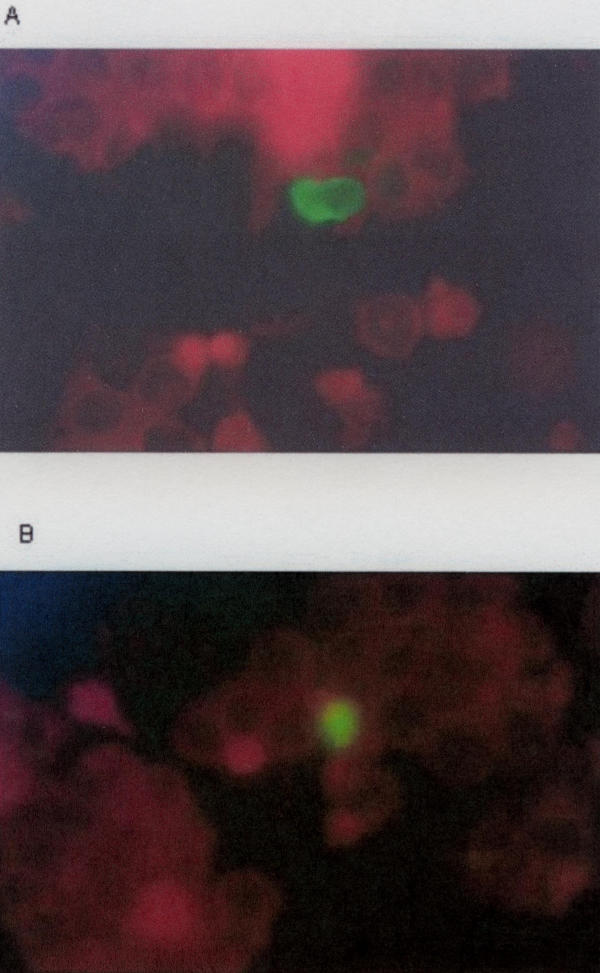
Results: The BJAB-B1 and P3HR-1 cells were observed to be susceptible to a CMV superinfection by detecting the major immediate early (MIE) viral transcript and protein (p52) expression. The BZLF1 transcript was observed in both cell lines superinfected with CMV, indicating EBV reactivation. BZLF1 protein was observed in the BJAB-B1 cells. Antigen detection was not performed in the P3HR-1 cells.

Conclusion: The results from the in vitro superinfections support the in vivo studies suggesting a CMV infection is related to an EBV reactivation and suggests that CMV may be important as a co-factor in EBV pathogenesis in the immunocompromised patient.


Figures

Figure 1
Figure 1
Real-time PCR of the CMV MIE transcript in BJAB-B1 cells. In all graphs, the axes are relative fluorescence units (RFUs) versus cycle number. Real-time PCR amplification of the CMV MIE transcript from superinfected BJAB-B1 cells was performed using 5 μl of cDNA from the RT reactions. Time points are at the given designations C7 (24 hours), C8 (48 hours), C9 (72 hours), C10 (96 hours), and C11 (168 hours) (A). Real-time PCR amplification of the CMV MIE transcript from BJAB-B1 cells incubated with UV-irradiated CMV (B). All time points were negative at the given designations G1 (24 hours), G2 (48 hours), G3 (72 hours), G4 (96 hours), and G5 (168 hours). CMV DNA copy standards were run in order to establish a standard curve for quantitative analysis. A1 (500,000 copies), A2 (5,000 copies), A3 (50 copies), and A4 (negative control) (C). Agarose (2%) gel electrophoresis of the real-time PCR samples was performed in order to show specificity of the PCR reactions. Positive control is as indicated. Shown here are the real-time PCR samples of the BJAB-B1 cells superinfected with CMV. Lanes 1–5 correlate to the time points 24, 48, 72, 96, and 168 hours (D).
Figure 2
Figure 2
Real-time PCR of the CMV MIE transcript in P3HR-1 cells. In all graphs, the axes are relative fluorescence units (RFUs) versus cycle number. CMV DNA copy standards were run in order to establish a standard curve for quantitative analysis. A1 (500,000 copies), A2 (5,000 copies), A3 (50 copies), and A4 (negative control) (data not shown). cDNA from the P3HR-1 cells were treated similarly to the BJAB-B1 cells. Shown are P3HR-1 cells superinfected with CMV (A) and cells exposed to UV-irradiated CMV (B). Uninfected cells were negative for any CMV transcript (data not shown). Time points are designated in the figure. For these set of experiments, 0, 24, 48, 72, 96, 120, and 168 hours post superinfection were performed. Agarose gel analyses were not performed.
Figure 3
Figure 3
Immunofluorescence of p52 antigen in BJAB-B1 cells superinfected with CMV. Immunofluorescence staining was performed to give a qualitative analysis of CMV protein expression and to further show susceptibility of infection. Approximately 50,000 BJAB-B1 cells for each experimental group were subjected to a cytospin for antigen staining. The cells were fixed in acetone and methanol (1:1) mixture and stained with the appropriate dilution of the FITC labelled antibody. Presence of the p52 antigen was positive at all time points (24, 48, 72, 96, and 168 hours), slide shown is at 24 hours post CMV superinfection. Uninfected cells and cells incubated with UV-irradiated CMV showed no presence of the p52 antigen (data not shown). Positive control slides (Chemicon, Temecula, CA) were stained with the antibody to show that the antibody was working (data not shown).
Figure 4
Figure 4
Immunofluorescence of p52 antigen in P3HR-1 cells superinfected with CMV. Immunofluorescence staining was performed to give a qualitative analysis of CMV protein expression and to further show susceptibility of infection. Approximately 50,000 P3HR-1 cells for each experimental group were subjected to a cytospin for antigen staining. The cells were fixed in acetone and methanol (1:1) mixture and stained with the appropriate dilution of the FITC labelled antibody. Presence of the p52 antigen was positive at all time points (24, 48, 72, 96, 120, and 168 hours), slide shown is at 24 hours post CMV superinfection. Uninfected cells and cells incubated with UV-irradiated CMV showed no presence of the p52 antigen (data not shown). Positive control slides were stained with the antibody to show that the antibody was working (data not shown).
Figure 5
Figure 5
BZLF1 Transcript Expression in BJAB-B1 Cells. BZLF1 transcript was chemically induced with PMA/ionomycin (1 μg/ml) as a positive control for EBV reactivation. Qualitative real-time PCR was performed to show positive expression of the BZLF1 transcript. Time points were taken at 24 hours (C2), 48 hours (C9), and 72 hours (E2). E6 represents unstimulated cells and also served as a negative control (A). Real-time PCR amplification of the BZLF1 transcript was performed using 5 μl of cDNA from the RT reactions among BJAB-B1 cells superinfected with CMV. Time points are at the given designations A8 (24 hours), A9 (48 hours), A10 (72 hours), A11 (96 hours), and A12 (168 hours) (B). Agarose (2%) gel electrophoresis of the real-time PCR samples was performed in order to show specificity of the PCR reactions (C).
Figure 6
Figure 6
BZLF1 transcript expression in P3HR-1 cells. BZLF1 transcript was chemically induced with PMA/ionomycin (1 μg/ml) as a positive control for EBV reactivation. Qualitative real-time PCR was performed to show positive expression of the BZLF1 transcript. Unstimulated cells served as a negative control (A). Real-time PCR amplification of the BZLF1 transcript was performed using 5 μl of cDNA from the RT reactions among P3HR-1 cells superinfected with CMV (B). Time points are indicated in both (A) and (B).
Figure 7
Figure 7
Immunofluorescence of the BZLF1 protein in BJAB-B1 cells. Immunofluorescence staining was performed to show production of viral protein, indicative of EBV reactivation. Stimulated cells and approximately 50,000 experimental sample cells were subjected to a cytospin and prepared similarly to the p52 staining protocol. A secondary FITC-labelled goat-anti-mouse antibody was used because the primary antibody was unlabelled. BJAB-B1 cells were stimulated with PMA/ionomycin (1 μg/ml) for the induction of the BZLF1 protein and for a positive control (A). Presence of the BZLF1 protein was observed within the CMV superinfected BJAB-B1 cells and only at 168 hours (B)

References

    1. Rosenthal KS. Human Herpesviruses. In: Farrell R, editor. Medical Microbiology. St. Louis, Missouri, Mosby-Year Books, Inc; 1994. pp. 571–594.
    1. Steven NM. Epstein-Barr Virus Infection in vivo. Rev Med Virol. 1997;7:97–106. doi: 10.1002/(SICI)1099-1654(199707)7:2<97::AID-RMV190>3.0.CO;2-M. - DOI - PubMed
    1. Magrath IT, Pizzo PA, Novikovs L, Levine AS. Enhancement of Epstein-Barr Virus Replication in Producer Cell Lines by a Combination Of Low Temperature and Corticosteroids. Virology. 1979;97:477–481. doi: 10.1016/0042-6822(79)90360-X. - DOI - PubMed
    1. Bauer G. Induction of Epstein-Barr Virus Early Antigens by Corticosteroids: Inhibition by TPA and Retinoic Acid. Int J Cancer. 1983;31:291–295. - PubMed
    1. Schuster C, Chasserot-Golaz S, Beck G. Activation of Epstein-Barr Virus promoters by a Growth Factor and a Glucocorticoid. FEBS Lett. 1991;284:82–86. doi: 10.1016/0014-5793(91)80767-W. - DOI - PubMed

MeSH terms

LinkOut - more resources