. 2002 Aug;22(16):5801-12.
doi: 10.1128/MCB.22.16.5801-5812.2002.

Human papillomavirus oncoprotein E6 inactivates the transcriptional coactivator human ADA3

Affiliations

Human papillomavirus oncoprotein E6 inactivates the transcriptional coactivator human ADA3

Ajay Kumar et al. Mol Cell Biol. 2002 Aug.

Abstract

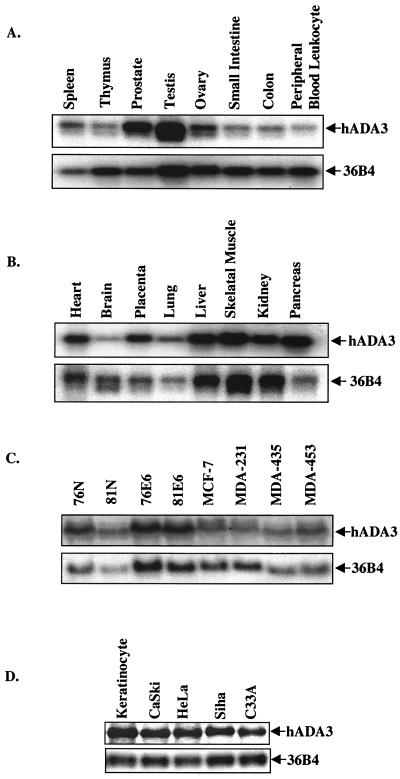
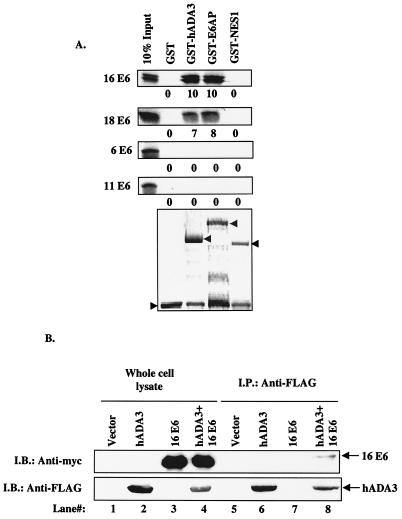
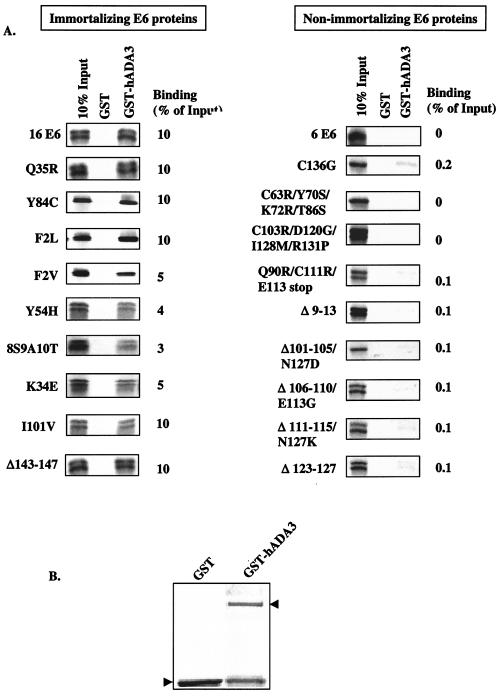
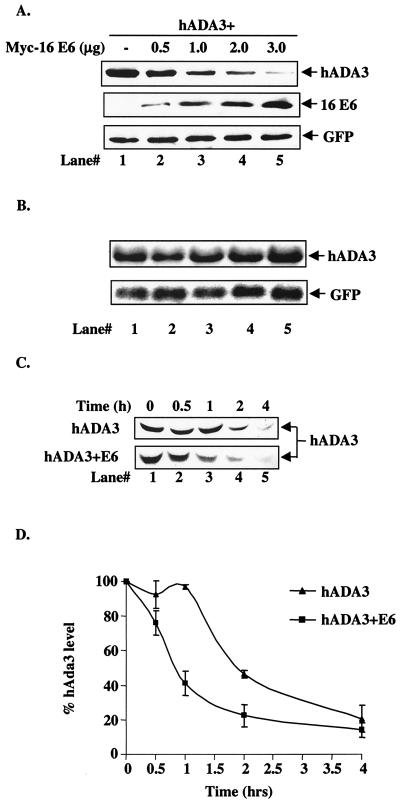
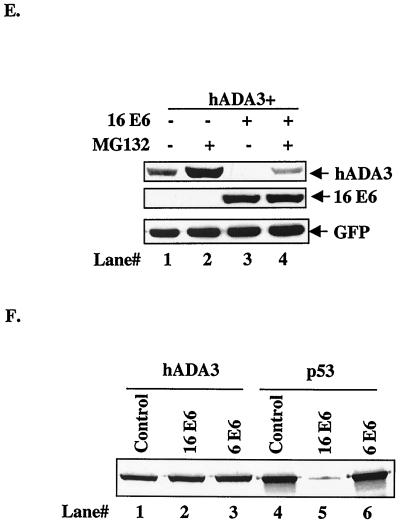
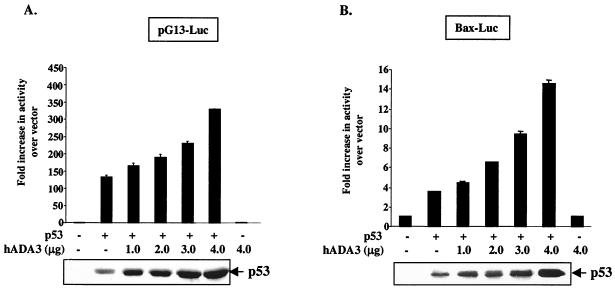
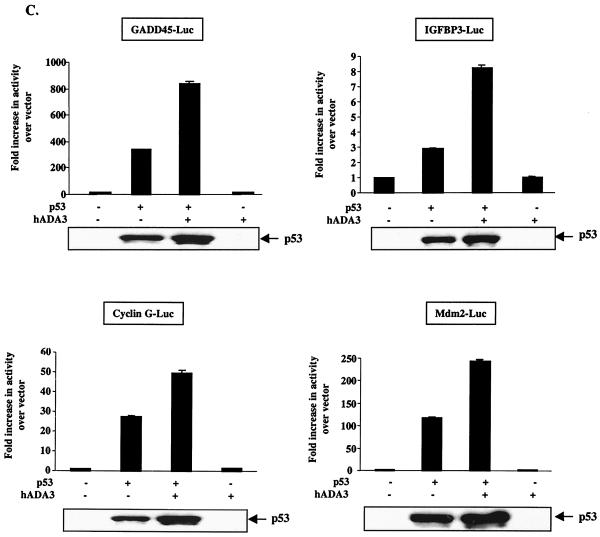
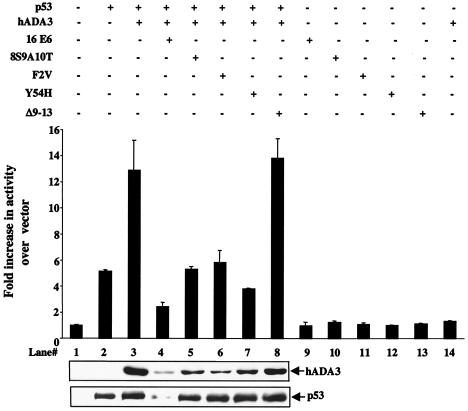
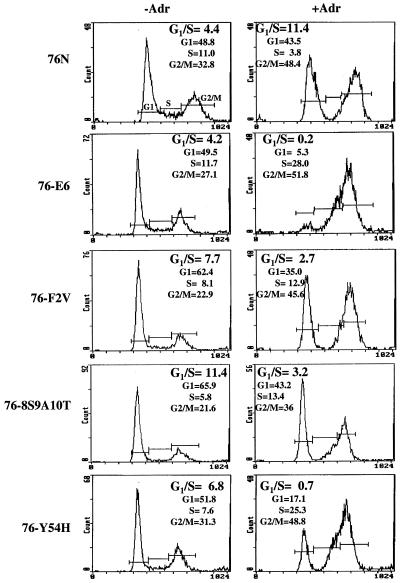
High-risk human papillomaviruses (HPVs) are associated with carcinomas of the cervix and other genital tumors. The HPV oncoprotein E6 is essential for oncogenic transformation. We identify here hADA3, human homologue of the yeast transcriptional coactivator yADA3, as a novel E6-interacting protein and a target of E6-induced degradation. hADA3 binds selectively to the high-risk HPV E6 proteins and only to immortalization-competent E6 mutants. hADA3 functions as a coactivator for p53-mediated transactivation by stabilizing p53 protein. Notably, three immortalizing E6 mutants that do not induce direct p53 degradation but do interact with hADA3 induced the abrogation of p53-mediated transactivation and G(1) cell cycle arrest after DNA damage, comparable to wild-type E6. These findings reveal a novel strategy of HPV E6-induced loss of p53 function that is independent of direct p53 degradation. Given the likely role of the evolutionarily conserved hADA3 in multiple coactivator complexes, inactivation of its function may allow E6 to perturb numerous cellular pathways during HPV oncogenesis.


Figures

FIG. 1.
FIG. 1.
ADA3 mRNA expression in human tissues and cultured cells. Blots containing 2 μg of poly(A)+ mRNA per lane (Tissue-Blot [Clontech]) (A and B) or 20 μg of total RNA (C and D) from normal (76N and 81N), immortal (76E6 and 81E6), and tumor (MCF-7, MDA-MB-231, MDA-MB-435, and MDA-MB-453) mammary epithelial cells (C) or from normal keratinocytes and cervical carcinoma cell lines (HeLa, CasKi, Siha, and C33A) (D) were probed with a 32P-labeled 1.3-kb hADA3 cDNA probe, followed by autoradiography. Hybridization with the 36B4 probe was used as a loading control. The arrows point to the major 1.3-kb transcript, which is seen at various levels in all cell lines and tissues.
FIG. 2.
FIG. 2.
In vitro and in vivo association between HPV E6 proteins and hADA3. (A) In vitro binding of high-risk (HPV16 and HPV18) and low-risk (HPV6 and HPV11) E6 proteins to hADA3. 35S-labeled E6 proteins were generated by in vitro translation with wheat germ lysate, and aliquots were allowed to bind to GST, GST-hADA3 (aa 75 to 432), GST-E6AP (as a positive control), or GST-NES1 (as a negative control) coated on glutathione-Sepharose beads. Bound E6 proteins were resolved by SDS-PAGE and visualized by fluorography. The input lane contains 10% of the aliquots used in the binding reactions. The numbers under each lane indicate the percent binding compared to the input, as determined by densitometry. The bottom panel shows Coomassie blue staining of the GST fusion proteins used in binding reactions. (B) In vivo association of hADA3 with HPV16 E6. A total of 106 293T cells per 100-mm dish were transfected with 0.5 μg of pCR3.1-FLAG-hADA3 or 2.5 μg of pEF-myc-HPV16 E6 (16 E6) alone or in combination, as indicated. After 48 h, the cell lysates were subjected to anti-FLAG immunoprecipitation, followed by either anti-myc (upper panel, lanes 5 to 8) or anti-FLAG (lower panel, lanes 5 to 8) immunoblotting (I.B.). Whole-cell lysates (10% input, lanes 1 to 4) were directly blotted with anti-myc antibody (upper panel) or anti-FLAG antibody (lower panel) to assess the expression of HPV16 E6 and hADA3, respectively.
FIG. 3.
FIG. 3.
In vitro binding of immortalizing (left panel) and nonimmortalizing (right panel) HPV16 E6 mutants to hADA3. (A) Equal aliquots of in vitro-translated 35S-labeled E6 proteins were allowed to bind to GST or GST-hADA3 (aa 75 to 432), and bound E6 proteins were then resolved by SDS-PAGE and visualized by fluorography. The input lane contains 10% of the aliquots used in the binding reactions. The numbers next to each lane indicate the percent binding compared to the input. Δ, Deletion. The immortalizing versus nonimmortalizing designation of each E6 mutant is derived from a mammary epithelial cell immortalization assay reported previously (12, 47). All mutant proteins are derivative of HPV16 E6. (B) The bottom panel shows Coomassie blue staining of the GST fusion proteins used in the binding reactions.
FIG. 4.
FIG. 4.
Reduction of hADA3 protein levels upon coexpression of HPV16 E6. (A) A total of 5 × 10⁵ 293T cells per 100-mm dish were transfected with 0.5 μg each of pCR3.1-FLAG-hADA3 either alone or together with increasing amounts of pEF-myc-HPV16 E6, as indicated. Five hundred nanograms of GFP DNA was included to assess the transfection efficiency. Total amount of DNA was kept constant by adding vector DNA. Cell lysates were prepared at 48 h posttransfection, and 30-μg aliquots of lysate protein were subjected to anti-FLAG immunoblotting (upper panel), followed by anti-myc (middle panel) and anti-GFP (lower panel) reblotting. (B) Duplicate plates of the transfections shown in panel A were used to isolate total cellular RNA, and 20-μg aliquots were used for Northern blotting with a 32P-labeled 1.3-kb hADA3 cDNA probe, followed by autoradiography (upper panel). A GFP cDNA probe was included in the hybridization mix as a control (lower panel). (C) Pulse-chase analysis of hADA3. 293T cells were transfected with 0.5 μg of pCR3.1-hADA3 alone or together with 2 μg of vector or pCR3.1-HPV16 E6. After 48 h, cells were metabolically pulse-labeled with [35S]methionine plus [35S]cysteine for 30 min and chased for the indicated time periods (shown in hours). Equal amounts of radiolabeled lysates (based on the counts per minute) were immunoprecipitated with anti-hADA3 antiserum and resolved by SDS-PAGE, followed by fluorography. A representative experiment is shown. (D) The amount of hADA3 was calculated by densitometry, and the percentage of hADA3 left was plotted against time indicated. The mean ± the standard deviation (SD) of three independent experiments is shown. (E) 293T cells were transfected with 0.5 μg of pCR3.1-FLAG-hADA3 alone or with 2.5 μg of pEF-myc-16 E6. At 20 h after transfection, the cells were either mock treated or treated with MG132 (50 μM) for 4 h. Immunoblotting was performed as for panel A. (F) Lack of in vitro degradation of hADA3 by E6. The 35S-labeled hADA3, p53, HPV6 E6, and HPV16 E6 proteins were generated by in vitro translation in rabbit reticulocyte lysates in the presence of [35S]cysteine (E6) or [35S]methionine (ADA3 and p53). Aliquots of 35S-labeled hADA3 (lanes 1 to 3) or p53 (lanes 4 to 6) were incubated with water-primed lysate (control; lanes 1 and 4) or HPV16 E6 (lanes 2 and 5) or HPV6 E6 (lanes 3 and 6) proteins for 15 h at 30°C. The hADA3 or p53 remaining at the end of the incubation period was resolved by SDS-PAGE and visualized by fluorography.
FIG. 4.
FIG. 4.
Reduction of hADA3 protein levels upon coexpression of HPV16 E6. (A) A total of 5 × 10⁵ 293T cells per 100-mm dish were transfected with 0.5 μg each of pCR3.1-FLAG-hADA3 either alone or together with increasing amounts of pEF-myc-HPV16 E6, as indicated. Five hundred nanograms of GFP DNA was included to assess the transfection efficiency. Total amount of DNA was kept constant by adding vector DNA. Cell lysates were prepared at 48 h posttransfection, and 30-μg aliquots of lysate protein were subjected to anti-FLAG immunoblotting (upper panel), followed by anti-myc (middle panel) and anti-GFP (lower panel) reblotting. (B) Duplicate plates of the transfections shown in panel A were used to isolate total cellular RNA, and 20-μg aliquots were used for Northern blotting with a 32P-labeled 1.3-kb hADA3 cDNA probe, followed by autoradiography (upper panel). A GFP cDNA probe was included in the hybridization mix as a control (lower panel). (C) Pulse-chase analysis of hADA3. 293T cells were transfected with 0.5 μg of pCR3.1-hADA3 alone or together with 2 μg of vector or pCR3.1-HPV16 E6. After 48 h, cells were metabolically pulse-labeled with [35S]methionine plus [35S]cysteine for 30 min and chased for the indicated time periods (shown in hours). Equal amounts of radiolabeled lysates (based on the counts per minute) were immunoprecipitated with anti-hADA3 antiserum and resolved by SDS-PAGE, followed by fluorography. A representative experiment is shown. (D) The amount of hADA3 was calculated by densitometry, and the percentage of hADA3 left was plotted against time indicated. The mean ± the standard deviation (SD) of three independent experiments is shown. (E) 293T cells were transfected with 0.5 μg of pCR3.1-FLAG-hADA3 alone or with 2.5 μg of pEF-myc-16 E6. At 20 h after transfection, the cells were either mock treated or treated with MG132 (50 μM) for 4 h. Immunoblotting was performed as for panel A. (F) Lack of in vitro degradation of hADA3 by E6. The 35S-labeled hADA3, p53, HPV6 E6, and HPV16 E6 proteins were generated by in vitro translation in rabbit reticulocyte lysates in the presence of [35S]cysteine (E6) or [35S]methionine (ADA3 and p53). Aliquots of 35S-labeled hADA3 (lanes 1 to 3) or p53 (lanes 4 to 6) were incubated with water-primed lysate (control; lanes 1 and 4) or HPV16 E6 (lanes 2 and 5) or HPV6 E6 (lanes 3 and 6) proteins for 15 h at 30°C. The hADA3 or p53 remaining at the end of the incubation period was resolved by SDS-PAGE and visualized by fluorography.
FIG. 5.
FIG. 5.
In vitro and in vivo interaction between hADA3 and p53. (A) In vitro binding between hADA3 and p53. Binding reaction mixtures included equal aliquots of [35S]methionine-labeled p53 generated by in vitro translation (as in Fig. 4F) and 1 μg of GST, GST-hADA3, GST-p300 (as a positive control), or GST-NES1 (as a negative control). Bound p53 protein was resolved by SDS-PAGE and detected by fluorography. The numbers under each lane indicate the percent binding as based on input control. The bottom panel shows Coomassie blue staining of the GST fusion proteins used in the binding reactions. (B) In vivo association of endogenous p53 with transfected hADA3. A total of 5 × 10⁵ U2OS cells were transfected with 2.5 μg of pCR3.1 vector or pCR3.1-hADA3 by using the Fugene reagent. After 48 h, 1-mg aliquots of cell lysate proteins were subjected to anti-p53 immunoprecipitation (I.P.) and immunoblotted (I.B.) with an anti-hADA3 serum (lanes 3 and 4). Whole-cell lysates (50 μg) were directly blotted with anti-hADA3 serum (lanes 1 and 2) to assess the expression of hADA3. (C) In vivo association between transfected p53 and hADA3. A total of 106 293T cells were transfected with 1 μg of FLAG-p53 and 8.0 μg of His-tagged hADA3 alone or in combination. At 40 h after transfection, the cells were lysed in binding buffer, and 400-μg aliquots of lysates were allowed to bind with His-Bind resin (Novagen). The bead-bound proteins were subjected to SDS-PAGE, followed by anti-FLAG immunoblotting to detect transfected p53 (upper panel, lanes 4 to 6). The membrane was reprobed with an anti-His antibody to assess the levels of hADA3 (lower panel, lanes 4 to 6). The cell lysate (lanes 1 to 3) represents 40-μg aliquots of lysate protein.
FIG. 6.
FIG. 6.
Enhancement of p53-dependent transactivation by hADA3. A total of 5 × 10⁵ Saos-2 cells were transfected with 25 ng (A) or 50 ng (B and C) of pCR3.1-p53 and pCR3.1-hADA3 (4 μg [C] or as indicated [A and B]), together with 250 ng (A) or 1 μg (B and C) of the indicated promoter-luciferase reporters. The total DNA amount for each transfection was kept constant by adding vector DNA. After 24 h of transfection, cells were lysed, and the luciferase activity was measured. Transactivation results were calculated as fold activation over vector. A total of 20 ng of pRL-SV40 was concurrently transfected and used to correct for differences in transfection. Data indicate mean ± SD of triplicates of a representative experiment. Experiments were repeated at least three times. A “−” indicates the vector DNA. The lysates of cells used in luciferase assays were analyzed by immunoblotting with an anti-p53 antibody (DO1) to assess the expression of p53 (lower panels).
FIG. 6.
FIG. 6.
Enhancement of p53-dependent transactivation by hADA3. A total of 5 × 10⁵ Saos-2 cells were transfected with 25 ng (A) or 50 ng (B and C) of pCR3.1-p53 and pCR3.1-hADA3 (4 μg [C] or as indicated [A and B]), together with 250 ng (A) or 1 μg (B and C) of the indicated promoter-luciferase reporters. The total DNA amount for each transfection was kept constant by adding vector DNA. After 24 h of transfection, cells were lysed, and the luciferase activity was measured. Transactivation results were calculated as fold activation over vector. A total of 20 ng of pRL-SV40 was concurrently transfected and used to correct for differences in transfection. Data indicate mean ± SD of triplicates of a representative experiment. Experiments were repeated at least three times. A “−” indicates the vector DNA. The lysates of cells used in luciferase assays were analyzed by immunoblotting with an anti-p53 antibody (DO1) to assess the expression of p53 (lower panels).
FIG. 7.
FIG. 7.
Inhibition of hADA3 coactivator function by HPV16 E6 proteins. A total of 5 × 10⁵ Saos-2 cells were cotransfected with 1 μg of Bax-luciferase reporter with or without 50 ng of pCR3.1-p53, 3 μg of pCR3.1-hADA3, and 2.5 μg of pCR3.1-16 E6 or its mutants, as indicated (+). The total DNA amount for each transfection was kept constant by adding vector DNA. After 24 h of transfection, the luciferase activity was measured as described in the legend for Fig. 6. For the expression of hADA3 and p53, the lysates described above were analyzed by Western blotting with anti-hADA3 serum (upper panel) or anti-p53 antibody (lower panel).
FIG. 8.
FIG. 8.
Abrogation of adriamycin-induced G1 cell cycle arrest in cells expressing p53-nondegrading E6 mutants. A total of 5 × 10⁵ cells of normal mammary epithelial cell strain (76N) or its derivatives immortalized with HPV16 E6 (76-E6), HPV16-F2V (76-F2V), HPV16-8S9A10T (76-8S9A10T), or HPV16-Y54H (76-Y54H) were cultured for 48 h and then treated with 0.5 μg of adriamycin/ml for 24 h. The cells were fixed, treated with RNase A, and stained with propidium iodide, and then their DNA content was quantified with a fluorescence-activated cell sorter. The G1, S, and G2/M phases of the cell cycle are indicated.

Similar articles

Cited by

References

    1. Ali, S. H., and J. A. DeCaprio. 2001. Cellular transformation by SV40 large T antigen: interaction with host proteins. Semin. Cancer Biol. 11:15-23. - PubMed
    1. Allan, L. A., and M. Fried. 1999. p53-dependent apoptosis or growth arrest induced by different forms of radiation in U2OS cells: p21WAF1/CIP1 repression in UV-induced apoptosis. Oncogene 18:5403-5412. - PubMed
    1. Anafi, M., Y. F. Yang, N. A. Barlev, M. V. Govindan, S. L. Berger, T. R. Butt, and P. G. Walfish. 2000. GCN5 and ADA adaptor proteins regulate triiodothyronine/GRIP1 and SRC-1 coactivator-dependent gene activation by the human thyroid hormone receptor. Mol. Endocrinol. 14:718-732. - PubMed
    1. Avantaggiati, M. L., V. Ogryzko, K. Gardner, A. Giordano, A. S. Levine, and K. Kelly. 1997. Recruitment of p300/CBP in p53-dependent signal pathways. Cell 89:1175-1184. - PubMed
    1. Baker, C. C., W. C. Phelps, V. Lindgren, M. J. Braun, M. A. Gonda, and P. M. Howley. 1987. Structural and transcriptional analysis of human papillomavirus type 16 sequences in cervical carcinoma cell lines. J. Virol. 61:962-971. - PMC - PubMed

Publication types

MeSH terms