

Mice lacking skeletal muscle actin show reduced muscle strength and growth deficits and die during the neonatal period
- PMID: 12138199
- PMCID: PMC133984
- DOI: 10.1128/MCB.22.16.5887-5896.2002
Mice lacking skeletal muscle actin show reduced muscle strength and growth deficits and die during the neonatal period
Abstract
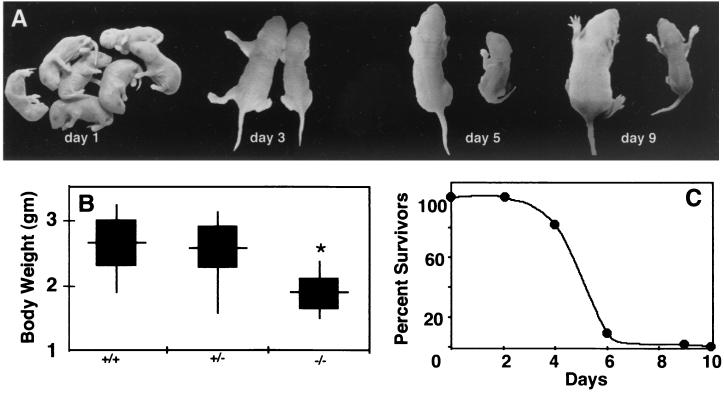
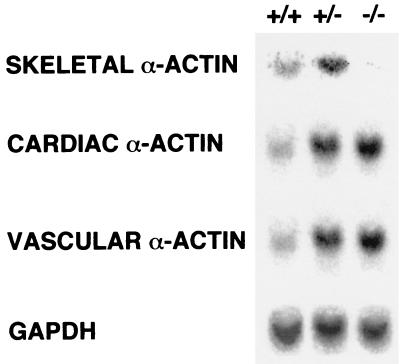
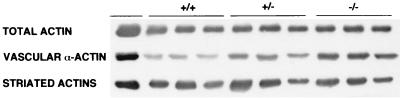
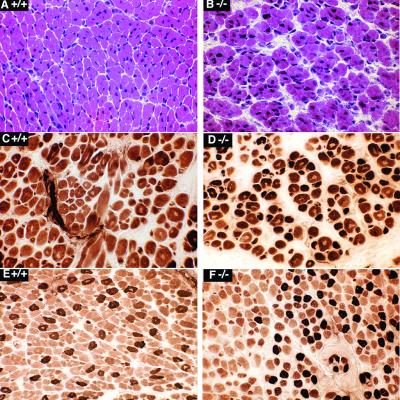
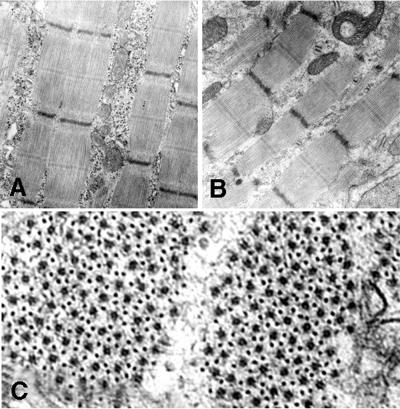
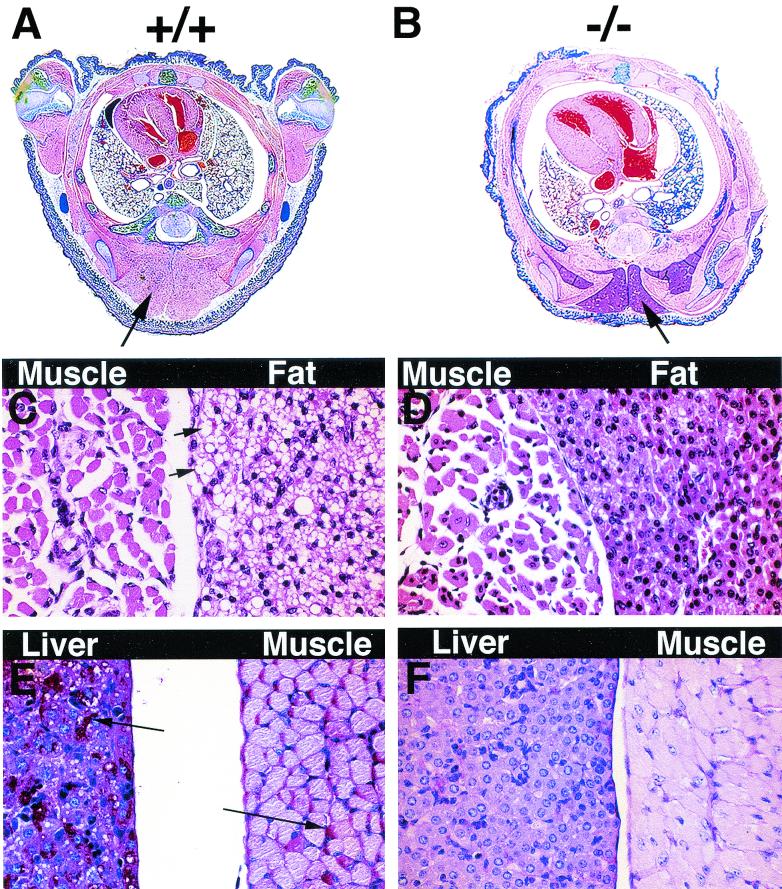
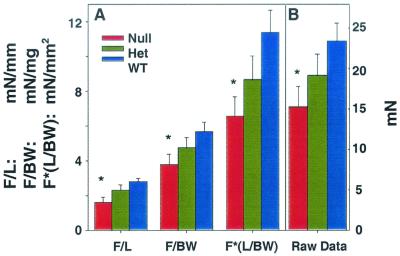
All four of the muscle actins (skeletal, cardiac, vascular, and enteric) in higher vertebrates show distinct expression patterns and display highly conserved amino acid sequences. While it is hypothesized that each of the muscle isoactins is specifically adapted to its respective tissue and that the minor variations among them have developmental and/or physiological relevance, the exact functional and developmental significance of these proteins remains largely unknown. In order to begin to assess these issues, we disrupted the skeletal actin gene by homologous recombination. All mice lacking skeletal actin die in the early neonatal period (day 1 to 9). These null animals appear normal at birth and can breathe, walk, and suckle, but within 4 days, they show a markedly lower body weight than normal littermates and many develop scoliosis. Null mice show a loss of glycogen and reduced brown fat that is consistent with malnutrition leading to death. Newborn skeletal muscles from null mice are similar to those of wild-type mice in size, fiber type, and ultrastructural organization. At birth, both hemizygous and homozygous null animals show an increase in cardiac and vascular actin mRNA in skeletal muscle, with no skeletal actin mRNA present in null mice. Adult hemizygous animals show an increased level of skeletal actin mRNA in hind limb muscle but no overt phenotype. Extensor digitorum longus (EDL) muscle isolated from skeletal-actin-deficient mice at day 2 to 3 showed a marked reduction in force production compared to that of control littermates, and EDL muscle from hemizygous animals displayed an intermediate force generation. Thus, while increases in cardiac and vascular smooth-muscle actin can partially compensate for the lack of skeletal actin in null mice, this is not sufficient to support adequate skeletal muscle growth and/or function.
Figures

Similar articles
-
Rescue of cardiac alpha-actin-deficient mice by enteric smooth muscle gamma-actin.Proc Natl Acad Sci U S A. 1997 Apr 29;94(9):4406-11. doi: 10.1073/pnas.94.9.4406. Proc Natl Acad Sci U S A. 1997. PMID: 9114002 Free PMC article.
-
Impaired vascular contractility and blood pressure homeostasis in the smooth muscle alpha-actin null mouse.FASEB J. 2000 Nov;14(14):2213-20. doi: 10.1096/fj.99-0927com. FASEB J. 2000. PMID: 11053242
-
Rescue of skeletal muscle alpha-actin-null mice by cardiac (fetal) alpha-actin.J Cell Biol. 2009 Jun 1;185(5):903-15. doi: 10.1083/jcb.200812132. Epub 2009 May 25. J Cell Biol. 2009. PMID: 19468071 Free PMC article.
-
Regulation of contraction in striated muscle.Physiol Rev. 2000 Apr;80(2):853-924. doi: 10.1152/physrev.2000.80.2.853. Physiol Rev. 2000. PMID: 10747208 Review.
-
Functional specificity of actin isoforms.Int Rev Cytol. 2001;202:35-98. doi: 10.1016/s0074-7696(01)02003-4. Int Rev Cytol. 2001. PMID: 11061563 Review.
Cited by
-
Morphological and functional alterations of neuromuscular synapses in a mouse model of ACTA1 congenital myopathy.Hum Mol Genet. 2024 Jan 20;33(3):233-244. doi: 10.1093/hmg/ddad183. Hum Mol Genet. 2024. PMID: 37883471 Free PMC article.
-
Combined MRI and ³¹P-MRS investigations of the ACTA1(H40Y) mouse model of nemaline myopathy show impaired muscle function and altered energy metabolism.PLoS One. 2013 Apr 16;8(4):e61517. doi: 10.1371/journal.pone.0061517. Print 2013. PLoS One. 2013. PMID: 23613869 Free PMC article.
-
The remodelling of actin composition as a hallmark of cancer.Transl Oncol. 2021 Jun;14(6):101051. doi: 10.1016/j.tranon.2021.101051. Epub 2021 Mar 21. Transl Oncol. 2021. PMID: 33761369 Free PMC article. Review.
-
Actin polymerization and depolymerization in developing vertebrates.Front Physiol. 2023 Sep 8;14:1213668. doi: 10.3389/fphys.2023.1213668. eCollection 2023. Front Physiol. 2023. PMID: 37745245 Free PMC article. Review.
-
Differential roles of α-, β-, and γ-actin in axon growth and collateral branch formation in motoneurons.J Cell Biol. 2017 Mar 6;216(3):793-814. doi: 10.1083/jcb.201604117. Epub 2017 Feb 28. J Cell Biol. 2017. PMID: 28246119 Free PMC article.
References
-
- Allen, D. L., and L. A. Leinwand. 2001. Postnatal myosin heavy chain isoform expression in normal mice and mice null for IIb or IId myosin heavy chains. Dev. Biol. 229:383-395. - PubMed
-
- Bradford, M. M. 1976. A rapid and sensitive method for the quantitation of microgram quantities of protein utilizing the principle of protein-dye binding. Anal. Biochem. 72:248-254. - PubMed
-
- Collins, T., J. E. Joya, R. M. Arkell, V. Ferguson, and E. C. Hardeman. 1997. Reappearance of the minor alpha-sarcomeric actins in postnatal muscle. Am. J. Physiol. 273:C1801-C1810. - PubMed
-
- Corbett, M. A., C. S. Robinson, G. F. Dunglison, N. Yang, J. E. Joya, A. W. Stewart, C. Schnell, P. W. Gunning, K. N. North, and E. C. Hardeman. 2001. A mutation in alpha-tropomyosin (slow) affects muscle strength, maturation and hypertrophy in a mouse model for nemaline myopathy. Hum. Mol. Genet. 10:317-328. - PubMed
Publication types
MeSH terms
Substances
LinkOut - more resources
Full Text Sources
Molecular Biology Databases