. 2002 Aug;22(16):5946-61.
doi: 10.1128/MCB.22.16.5946-5961.2002.

R-Ras3/M-Ras induces neuronal differentiation of PC12 cells through cell-type-specific activation of the mitogen-activated protein kinase cascade

Affiliations

R-Ras3/M-Ras induces neuronal differentiation of PC12 cells through cell-type-specific activation of the mitogen-activated protein kinase cascade

Alec C Kimmelman et al. Mol Cell Biol. 2002 Aug.

Abstract

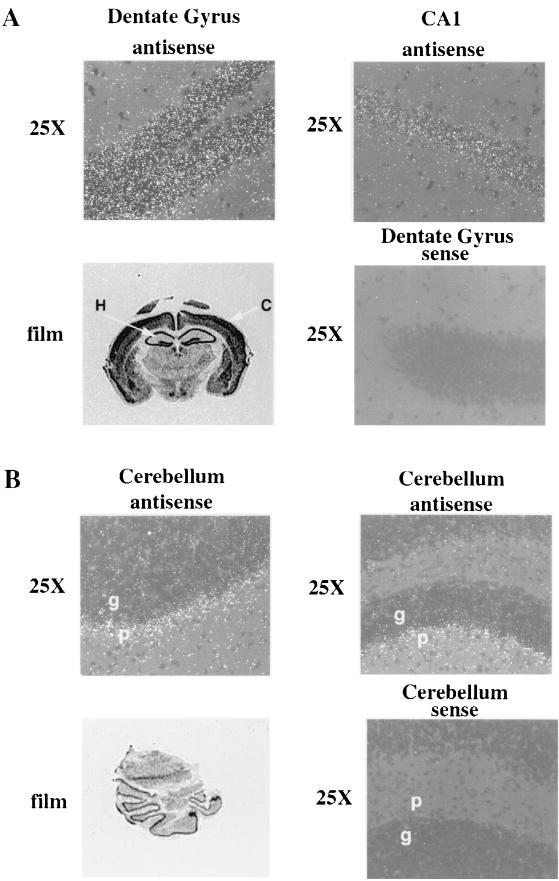
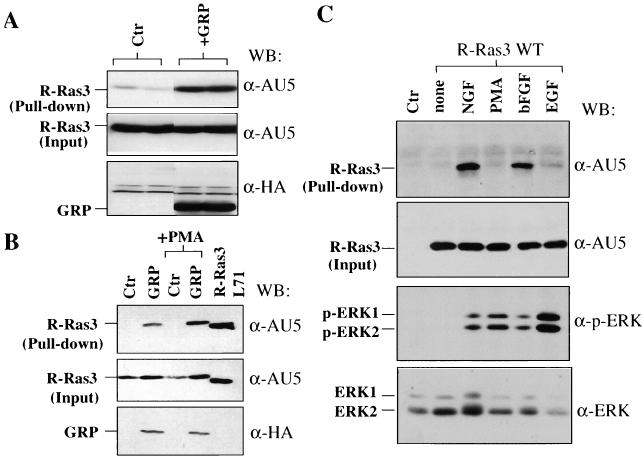
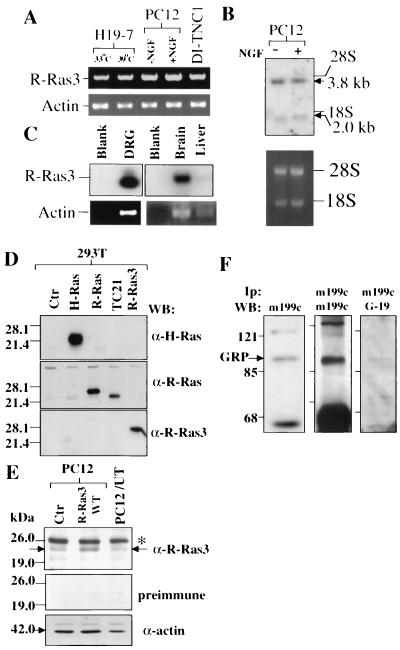
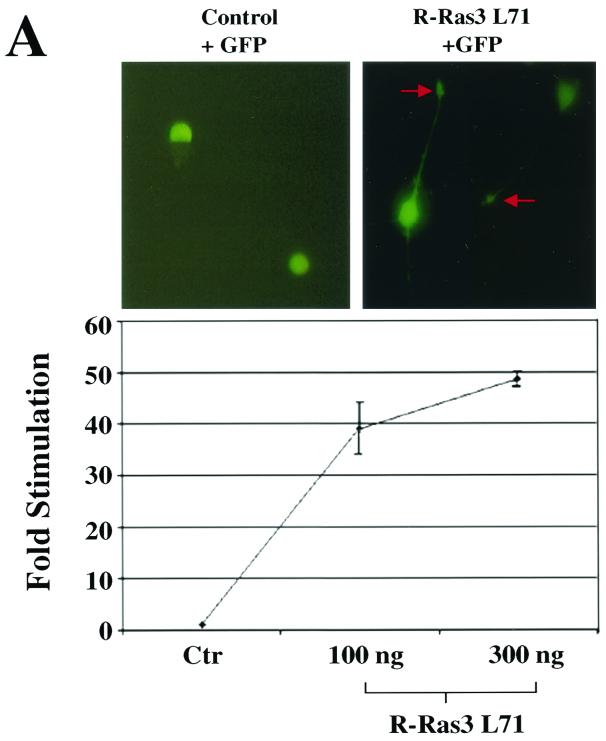
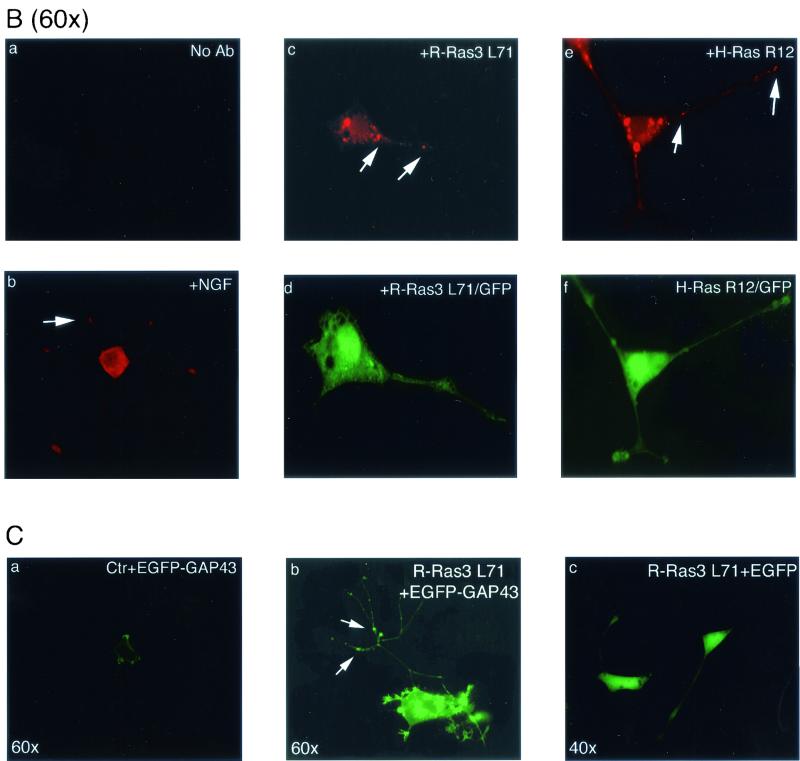
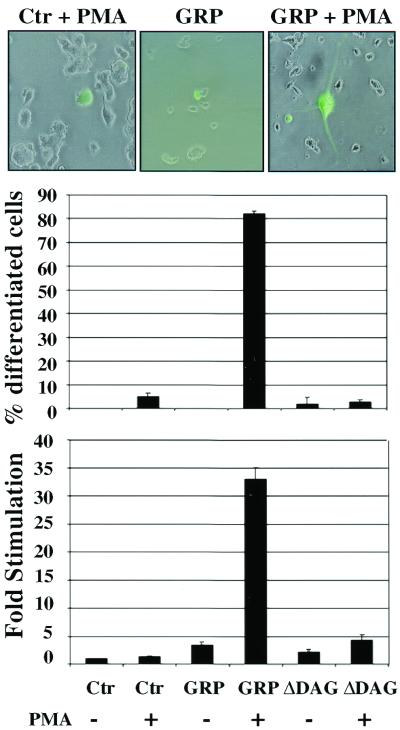
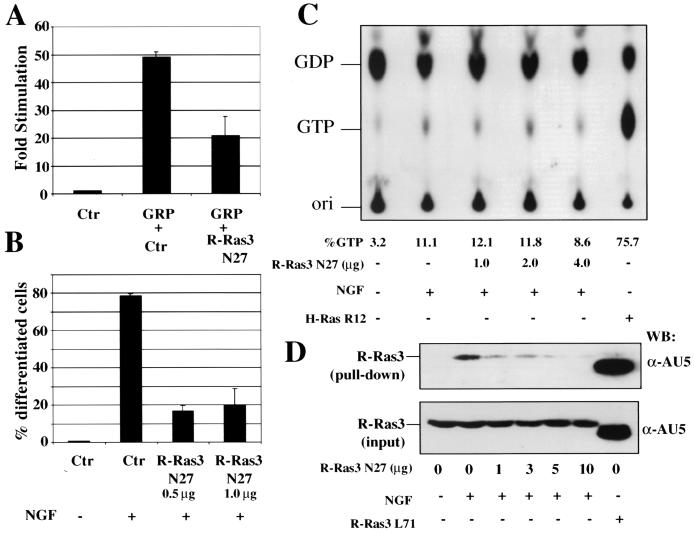
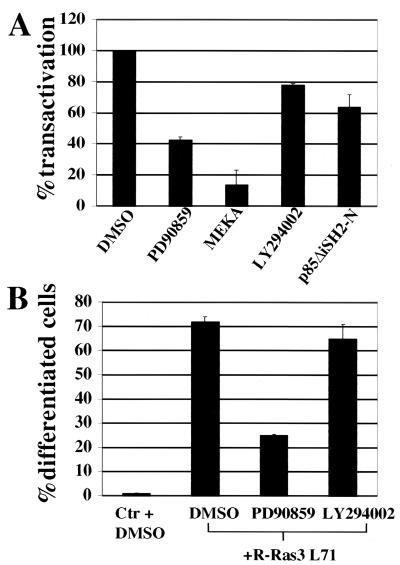
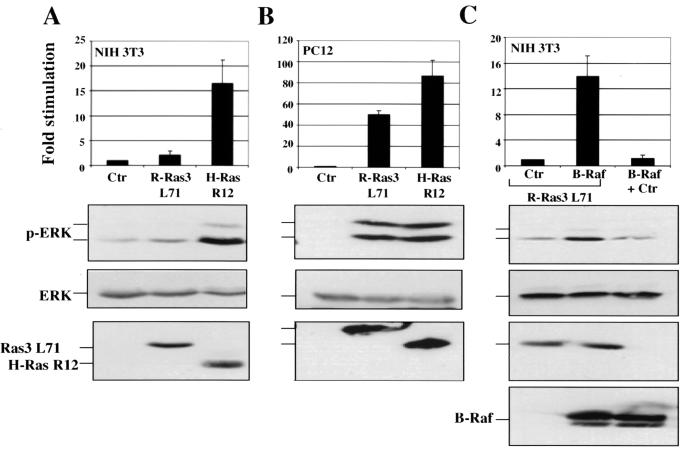
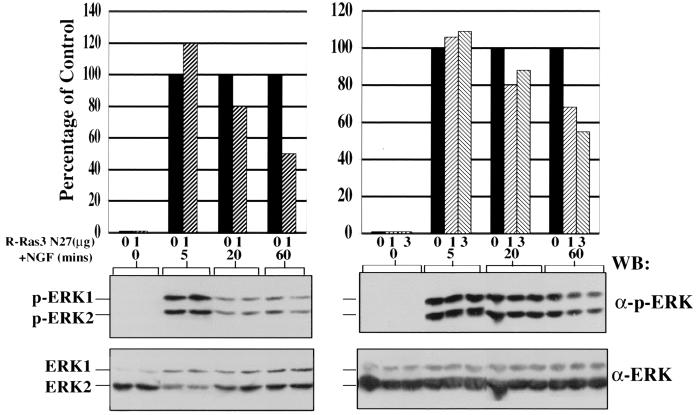
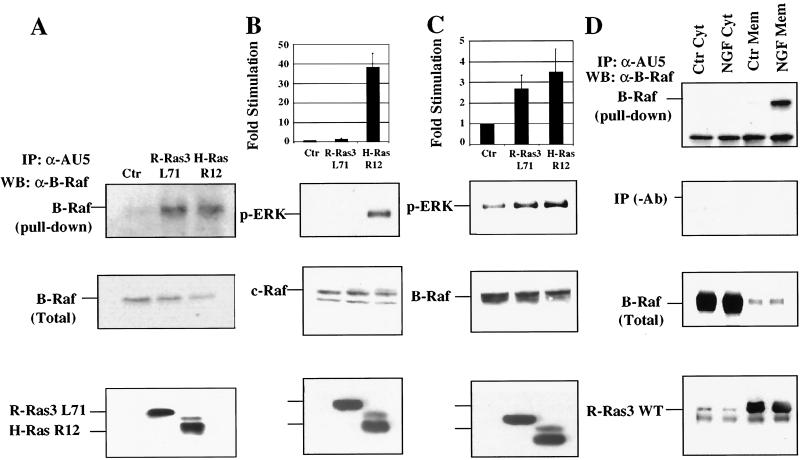
R-Ras3/M-Ras is a novel member of the Ras subfamily of GTP-binding proteins which has a unique expression pattern highly restricted to the mammalian central nervous system. In situ hybridization using an R-Ras3 cRNA probe revealed high levels of R-Ras3 transcripts in the hippocampal region of the mouse brain as well as a pattern of expression in the cerebellum that was distinct from that of H-Ras. We found that R-Ras3 was activated by nerve growth factor (NGF) and basic fibroblast growth factor as well as by the guanine nucleotide exchange factor GRP but not by epidermal growth factor. Ectopic expression of either R-Ras3 or GRP in PC12 cells induced efficient neuronal differentiation. The ability of NGF as well as GRP to promote differentiation of PC12 cells was attenuated by an R-Ras3 dominant-negative mutant. Furthermore, the biological action of R-Ras3 in PC12 cells was dependent on the mitogen-activated protein kinase (MAPK). Interestingly, whereas R-Ras3 was unable to mediate efficient activation of MAPK activity in NIH 3T3 cells, it was able to do so in PC12 cells. This cell-type specificity is in stark contrast to that of H-Ras, which can stimulate the MAPK pathway in both cell types. Indeed, this pattern of MAPK activation could be explained by the fact that R-Ras3 was unable to activate c-Raf, while it bound and stimulated the neuronal Raf isoform, B-Raf, in PC12 cells. Thus, R-Ras3 is implicated in a novel pathway of neuronal differentiation by coupling specific trophic factors to the MAPK cascade through the activation of B-Raf.


Figures

FIG. 1.
FIG. 1.
In situ hybridization of juvenile mouse brain tissue with an R-Ras3 cRNA probe. (Panels A) Two regions of the hippocampus (Dentate Gyrus and CA1) are depicted, illustrating the high levels of R-Ras3 expression evidenced by the bright grains under dark-field microscopy. An autoradiograph of an anterior coronal section exposed to X-ray film is shown (film) to demonstrate the high levels of R-Ras3 transcript seen in the cortex (C) as well as in the entire hippocampus (H). (Panels B) Sections of the cerebellum, showing the expression of R-Ras3 restricted mostly to the Purkinje (p) but not the granular (g) layer. A section exposed to X-ray film (film) shows this restricted expression pattern throughout the entire cerebellum. To ensure the specificity of the probe, sections were also hybridized with a sense R-Ras3 probe (sense), with no signal being detected.
FIG. 2.
FIG. 2.
Stimulation of R-Ras3 GTP binding in mammalian cells. (A) 293T cells were transiently transfected with 1 μg of AU5-tagged R-Ras3 WT along with 10 μg of either a control vector (Ctr) or an HA-tagged GRP exchange factor plasmid (+GRP). Transfected cells were starved in 0.3% FCS for 20 h and subsequently solubilized and incubated with the GST-p110 RBD pull-down probe. The affinity complexes were resolved on an SDS-12.5% polyacrylamide gel and subjected to Western blot analysis. Results from a representative of three experiments performed in duplicate are depicted. The amount of R-Ras3-GTP bound (pull-down) and its expression levels in total cell extracts (input) were detected using an anti-AU5 antibody. The expression levels of GRP were determined with an anti-HA antibody (lower panel). (B) The levels of the GTP-bound form of R-Ras3 were determined in PC12 cells by the affinity pull-down assay. Cultures were transfected with the AU5-tagged R-Ras3 WT plasmid together with the indicated plasmids. Transfected cells were maintained in low-serum conditions (1.0% serum) for 20 h, and selected cultures were treated with 100 nM PMA. As a positive control, an activated mutant of R-Ras3 (R-Ras3 L71) was included. A representative of at least two experiments is shown, and Western blot analysis was carried out as described for panel A. (C) The relative ability of different factors to stimulate transfected R-Ras3 in PC12 cells was assayed as for panel B. The efficacy of the stimuli was monitored based on their ability to activate ERK phosphorylation (p-ERK1 and p-ERK2).
FIG. 3.
FIG. 3.
Expression of R-Ras3 and GRP in PC12 cells. (A) RT-PCR was performed using cDNA prepared from H19-7 cells exposed to different temperatures, from PC12 cells, and from DI-TNC1 cells. All PCRs were resolved on a 1.5% agarose gel and stained with ethidium bromide. The ∼630-bp products amplified using R-Ras3 specific primers are indicated. As the control, parallel tubes were amplified using a pair of actin primers (lower panel). (B) Northern blot analysis of R-Ras3 expression was carried out using total RNA prepared from PC12 cells treated with NGF (+) or left untreated (−). RNA was transferred onto nitrocellulose filters and hybridized with a [α32P]dCTP-labeled rat R-Ras3 cDNA probe. The two R-Ras3 transcripts are indicated, and equal sample loading was ascertained by the levels of ethidium bromide-stained 28S and 18S rRNA (lower panel). (C) The expression of R-Ras3 in various tissues was analyzed by RT-PCR techniques as described for panel A, except that the authenticity of the PCR-amplified products was confirmed by Southern blot analysis with a [α32P]dCTP-labeled mouse R-Ras3 cDNA probe. DRG, dorsal root ganglion. (D) An anti-R-Ras3 polyclonal antibody was tested for specificity using 293T cell lysates overexpressing various Ras-related GTPases. Individual filters were incubated with the indicated antibodies (upper three panels). (E) A similar Western blot analysis was performed using 60 μg of total cell extracts from PC12 cells transfected either with a control plasmid (Ctr) or a non-epitope-tagged WT R-Ras3 expression vector. An additional lane was also loaded with 30 μg of an untreated PC12 lysate (PC12/UT). The arrow indicates the mobility of R-Ras3. The identity of a higher-molecular-mass band was not known (asterisk). Parallel Western blots were also incubated with the preimmune serum or an anti-actin antibody to confirm equal protein loading. (F) Expression of GRP in PC12 cellswas examined. PC12 lysate was subjected to Western blot analysis with the anti-GRP monoclonal antibody m199c (left panel). Alternatively, GRP was first immunoprecipitated (Ip) from ∼1 mg of PC12 lysate with m199c followed by Western blot (WB) analysis using m199c (middle panel) or an anti-GRP goat polyclonal antibody, G-19 (right panel). The predicted ∼90-kDa gene product of GRP is indicated with an arrow.
FIG. 4.
FIG. 4.
R-Ras3-induced differentiation in PC12. (A) PC12 cells were transfected with 2 μg of either a control vector (top left panel) or an activated R-Ras3 (R-Ras3 L71) expression plasmid (top right panel) (×40 magnification). To mark transfected cells, a GFP expression plasmid was cotransfected in each case. Two representative R-Ras3-transfected cells are shown 48 h after transfection, demonstrating the protrusion of neurites and growth cone-like structures as indicated with red arrows (top right panel). R-Ras3-induced neuronal differentiation was also measured by the NF-L transcriptional reporter assay, as described in the Materials and Methods section (lower panel). PC12 cells were transfected with an increasing amount of R-Ras3 L71 along with 1 μg of the reporter plasmid, and the luciferase activity was measured 48 h later. All luciferase readings were normalized to the amount of total cell lysate and expressed as fold increase over control vector (Ctr)-transfected cells. Error bars represent standard deviations derived from triplicate plates of a representative experiment performed at least twice. (B) Immunofluorescence analysis of GAP-43 expression in differentiated PC12 cells. PC12 cells were transfected with a control vector (panels a and b) or cotransfected with R-Ras3 L71 and GFP (panels c and d) or H-Ras R12 and GFP (panels e and f). Vector-transfected cells were left untreated (panel a) or treated with (panel b) NGF for 3 days. Expression and localization of GAP-43 were investigated with an anti-GAP-43 antibody and then detected with a Texas Red-conjugated anti-mouse secondary antibody (panels b, c, and e). One of the vector-transfected control cultures was not incubated with the primary antibody and served as a negative control (panel a). Vesicular expression of GAP-43 along the neurites is indicated with arrows. Transfected cells were determined by GFP fluorescence signals (panels d and f). (C) To confirm the GAP-43 expression data, PC12 cells were transfected with a pCA-GAP-EGFP expression plasmid together with either a control vector (panel a) or R-Ras3 L71 (panel b). Arrows highlight the accumulation of punctate green fluorescence signals along the neurites. In contrast, R-Ras3 L71 cotransfected with the pCA-EGFP control plasmid displayed a more homogenous staining pattern throughout the entire cell (panel c shows two such cells [×40 magnification]).
FIG. 4.
FIG. 4.
R-Ras3-induced differentiation in PC12. (A) PC12 cells were transfected with 2 μg of either a control vector (top left panel) or an activated R-Ras3 (R-Ras3 L71) expression plasmid (top right panel) (×40 magnification). To mark transfected cells, a GFP expression plasmid was cotransfected in each case. Two representative R-Ras3-transfected cells are shown 48 h after transfection, demonstrating the protrusion of neurites and growth cone-like structures as indicated with red arrows (top right panel). R-Ras3-induced neuronal differentiation was also measured by the NF-L transcriptional reporter assay, as described in the Materials and Methods section (lower panel). PC12 cells were transfected with an increasing amount of R-Ras3 L71 along with 1 μg of the reporter plasmid, and the luciferase activity was measured 48 h later. All luciferase readings were normalized to the amount of total cell lysate and expressed as fold increase over control vector (Ctr)-transfected cells. Error bars represent standard deviations derived from triplicate plates of a representative experiment performed at least twice. (B) Immunofluorescence analysis of GAP-43 expression in differentiated PC12 cells. PC12 cells were transfected with a control vector (panels a and b) or cotransfected with R-Ras3 L71 and GFP (panels c and d) or H-Ras R12 and GFP (panels e and f). Vector-transfected cells were left untreated (panel a) or treated with (panel b) NGF for 3 days. Expression and localization of GAP-43 were investigated with an anti-GAP-43 antibody and then detected with a Texas Red-conjugated anti-mouse secondary antibody (panels b, c, and e). One of the vector-transfected control cultures was not incubated with the primary antibody and served as a negative control (panel a). Vesicular expression of GAP-43 along the neurites is indicated with arrows. Transfected cells were determined by GFP fluorescence signals (panels d and f). (C) To confirm the GAP-43 expression data, PC12 cells were transfected with a pCA-GAP-EGFP expression plasmid together with either a control vector (panel a) or R-Ras3 L71 (panel b). Arrows highlight the accumulation of punctate green fluorescence signals along the neurites. In contrast, R-Ras3 L71 cotransfected with the pCA-EGFP control plasmid displayed a more homogenous staining pattern throughout the entire cell (panel c shows two such cells [×40 magnification]).
FIG. 5.
FIG. 5.
GRP-induced differentiation of PC12 cells. Morphological differentiation of PC12 cells was induced by ectopic expression of GRP only in the presence of 100 nM PMA. Control (Ctr) cells exposed to PMA (left micrograph) or GRP alone (center micrograph) failed to induce neurite outgrowth in GFP-marked cells. The extent of GRP-induced differentiation in the presence of PMA was quantified by scoring ∼50 GFP-positive cells for neurites (middle panel). Error bars represent standard deviations derived from a representative experiment performed at least twice. GRP effects on PC12 cells were further ascertained using the NF-L luciferase reporter as described for Fig. 4 (bottom panel). Cells were transfected with 2 μg of either GRP or GRPΔDAG (which does not bind the DAG analogue PMA). Luciferase activity was measured in the presence (+) or absence (−) of 100 nM PMA. The data are expressed as fold increase over control, with error bars representing standard deviations derived from triplicate measurements of a representative experiment.
FIG. 6.
FIG. 6.
The role of R-Ras3 in PC12 differentiation. (A) PC12 cells were transfected with GRP (2 μg), a control vector (0.5 μg), and R-Ras3 N27 dominant-negative mutant (0.5 μg). Around 48 h after transfection, 100 nM PMA was added, and luciferase reporter assays were performed 24 h later. The data are expressed as fold increase over control, with error bars representing standard deviations derived from a representative experiment of two performed. (B) PC12 cells were transfected with the indicated amounts of R-Ras3 N27 or with a control vector (Ctr). To mark transfected cells, 0.2 μg of a GFP expression plasmid was cotransfected in each plate. Cultures were treated with NGF (100 ng/ml) 24 h after transfection. The number of cells with neurites was scored by assessing at least 50 transfected cells 3 days later. The results of a representative experiment performed at least twice are shown with error bars representing the standard deviations derived from triplicate measurements. (C) The ability of R-Ras3 N27 to block H-Ras activation was examined by first transfecting PC12 cells with the indicated amount of R-Ras3 N27. As a positive control, parallel cultures were transfected with an oncogenic H-Ras R12 expression plasmid. Cells were then metabolically labeled with [α32P]orthophosphate for 5 h, and selected cultures were exposed to NGF for 5 min. H-Ras proteins were immunoprecipitated with an anti-Ras antibody, and the nucleotide bound was resolved on a thin-layer chromatography plate. The percentage of GTP was determined, and results are from a single experiment which had been repeated once with similar results being obtained. (D) The efficacy of R-Ras3 N27 in blocking activation of R-Ras3 WT by NGF was investigated. PC12 cells were transfected with the indicated amount of R-Ras3 N27 followed by the addition of NGF for 5 min. The level of R-Ras3-GTP was monitored by assessing binding to the GST-p110 RBD fusion protein as described in the legend of Fig. 2. A greater than 70% inhibition of R-Ras3 activation was observed with the use of only 1 μg of R-Ras3 N27.
FIG. 7.
FIG. 7.
Effects of MAPK- and PI3-K-specific inhibitors on R-Ras3-induced neuronal differentiation in PC12 cells. (A) The ability of R-Ras3 L71 to promote transactivation from the NF-L luciferase reporter was determined in the presence of either a chemical inhibitor or a dominant-negative mutant of the MAPK (50 μM PD90859 [MEKA]) or PI3-K (10 μM LY294002 [p85ΔiSH2-N]) pathway. The data delineate the percentage of suppression of transactivation by these inhibitors. Error bars represent standard deviations derived from a representative of two independent experiments performed in triplicate. (B) Parallel cultures cotransfected with R-Ras3 L71 and GFP were treated with dimethyl sulfoxide, PD90859, or LY294002. The fraction of GFP-positive cells which displayed morphological differentiation was scored as outlined for Fig. 4. Data represent results from triplicate measurements, with standard deviations derived from a representative of two independent experiments.
FIG. 8.
FIG. 8.
Activation of MAPK pathway by R-Ras3. (A) NIH 3T3 cells were transfected with 5 μg of expression plasmids for activated R-Ras3 (R-Ras L71), H-Ras (H-Ras R12), or a control plasmid (Ctr). Approximately 100 μg of total cell lysate was resolved on an SDS-12.5% polyacrylamide gel, followed by Western blot analysis with a phospho-specific ERK antibody (p-ERK). The levels of ERK were determined using an anti-ERK2 antibody (ERK). The levels of R-Ras3 L71 and H-Ras R12 were detected using an anti-AU5 antibody. (B) The ability of R-Ras3 L71 and H-Ras R12 to activate the MAPK pathway was analyzed in PC12 cells under conditions similar to that described for NIH 3T3 cells. (C) To restore the ability of R-Ras3 to activate ERK in NIH 3T3 cells, 10 μg of either control vector (Ctr) or B-Raf plasmid was cotransfected along with 5 μg of R-Ras3 L71 expression plasmid in NIH 3T3 cells. B-Raf alone failed to stimulate any detectable activation of ERK. All results were quantified and were derived from a representative experiment that was performed at least twice and are expressed as fold increase compared to the control, with error bars representing standard deviations derived from triplicate plates.
FIG. 9.
FIG. 9.
Effects of expressing R-Ras3 N27 on NGF-induced MAPK activity. PC12 cells were transfected with the indicated amount of R-Ras3 N27 or control (Ctr) vector. Cells were treated with NGF, and the extent of phosphorylation of ERK1 and ERK2 was monitored at various time points. Results from two separate experiments are shown. The band intensity of phosphorylated ERK1 and ERK2 was first quantified by an imaging densitometer and then normalized for the corresponding expression levels of total ERK1 and ERK2. Data are summarized in the top panel, which represents the percentages of ERK1 and ERK2 phosphorylation relative to the vector control-transfected cells at the indicated time point.
FIG. 10.
FIG. 10.
Binding and activation of B-Raf by R-Ras3. (A) PC12 cells were transfected with 5 μg of R-Ras3 L71, H-Ras R12, or a control (Ctr) plasmid. R-Ras3 and H-Ras were immunoprecipitated (IP) from total cell extracts by using an anti-AU5 antibody. The resultant immunoprecipitates were subjected to SDS-PAGE followed by Western blot analysis (WB). The top panel shows the amount of B-Raf present in the immunoprecipitates. The middle panel shows the levels of B-Raf expression in total cell lysate, and the lower panel shows the expression of transfected R-Ras3 L71 and H-Ras R12 using the anti-AU5 antibody. The data shown are representative of three independent experiments. (B) PC12 cells were transfected with 5 μg of the indicated plasmids. After incubation in low-serum medium, c-Raf was immunoprecipitated and in vitro Raf kinase assays were performed after adding recombinant MEK1 and ERK2. The reaction products were subjected to SDS-PAGE, followed by Western blot analysis with the phospho-specific ERK antibody (p-ERK). The levels of c-Raf, R-Ras3 L71, and H-Ras R12 were determined with their respective antibodies. The results of two independent experiments were quantified by densitometric analysis and expressed as fold increase compared to control (top panel). (C) Similar kinase assays were performed for B-Raf, using essentially the same method as that described for panel B. (D) NGF-induced B-Raf recruitment to the plasma membrane by R-Ras3 was investigated. Approximately 3 × 10⁶ PC12 cells were transfected with 6 μg of R-Ras3 WT expression vector and treated with NGF (+) or left untreated (−) for 5 min. Total cell extract were prepared and fractionated into cytosolic (Cyt) or membrane (Mem) fractions. R-Ras3 WT was immunoprecipitated with an anti-AU5 antibody, and the associated B-Raf was mainly found in the membrane fraction of NGF-stimulated cells (top panel). The expression of B-Raf and R-Ras3 was mainly confined to the cytosol and membrane fractions, respectively (bottom two panels).

Similar articles

Cited by

References

    1. Barbacid, M. 1987. ras genes. Annu. Rev. Biochem. 56:779-827. - PubMed
    1. Bar-Sagi, D., and J. R. Feramisco. 1985. Microinjection of the ras oncogene protein into PC12 cells induces morphological differentiation. Cell 42:841-848. - PubMed
    1. Boguski, M. S., and F. McCormick. 1993. Proteins regulating Ras and its relatives. Nature 366:643-654. - PubMed
    1. Bos, J. L. 1998. All in the family? New insights and questions regarding interconnectivity of Ras, Rap1 and Ral. EMBO J. 17:6776-6782. - PMC - PubMed
    1. Bos, J. L. 1989. ras oncogenes in human cancer: a review. Cancer Res. 49:4682-4689. - PubMed

Publication types

MeSH terms

LinkOut - more resources