. 2002 Aug;22(16):5975-88.
doi: 10.1128/MCB.22.16.5975-5988.2002.

Cell cycle arrest and repression of cyclin D1 transcription by INI1/hSNF5

Affiliations

Cell cycle arrest and repression of cyclin D1 transcription by INI1/hSNF5

Zhi-Kai Zhang et al. Mol Cell Biol. 2002 Aug.

Abstract

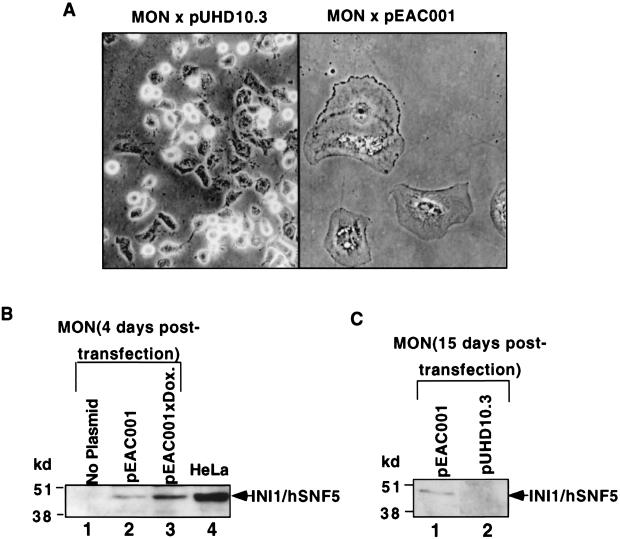
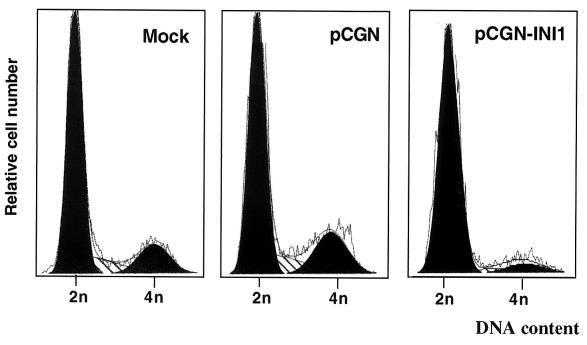
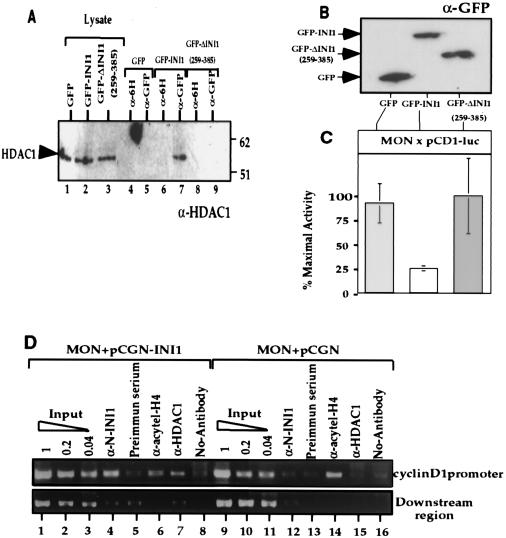
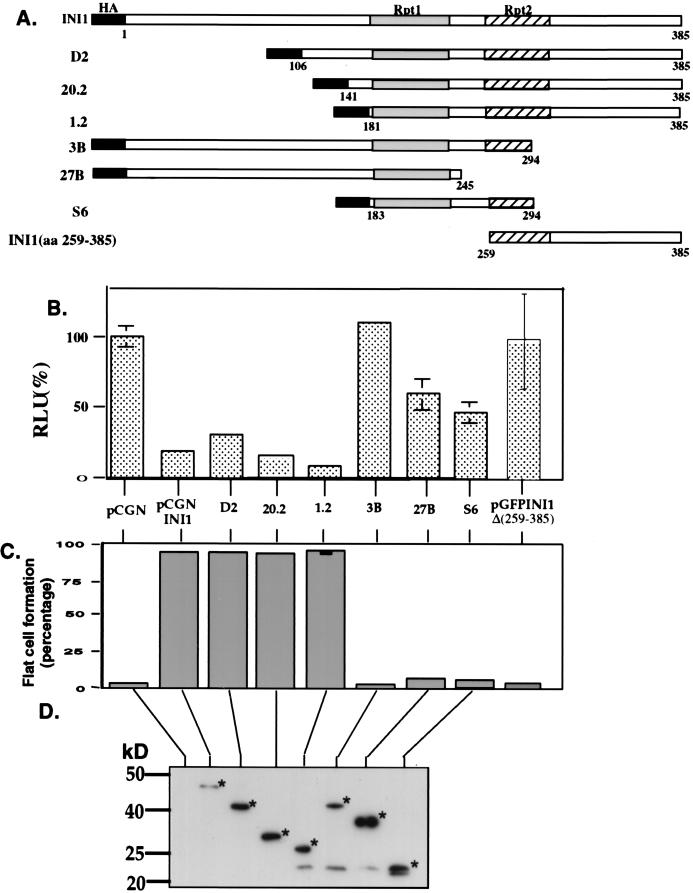
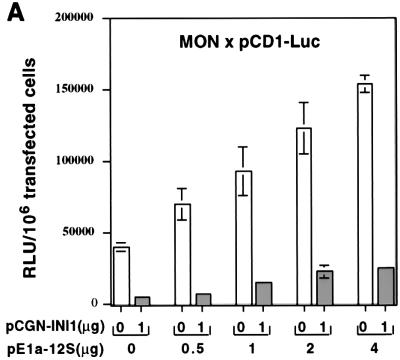
INI1/hSNF5 is a component of the ATP-dependent chromatin remodeling hSWI/SNF complex and a tumor suppressor gene of aggressive pediatric atypical teratoid and malignant rhabdoid tumors (AT/RT). To understand the molecular mechanisms underlying its tumor suppressor function, we studied the effect of reintroduction of INI1/hSNF5 into AT/RT-derived cell lines such as MON that carry biallelic deletions of the INI1/hSNF5 locus. We demonstrate that expression of INI1/hSNF5 causes G(0)-G(1) arrest and flat cell formation in these cells. In addition, INI1/hSNF5 repressed transcription of cyclin D1 gene in MON, in a histone deacetylase (HDAC)-dependent manner. Chromatin immunoprecipitation studies revealed that INI1/hSNF5 was directly recruited to the cyclin D1 promoter and that its binding correlated with recruitment of HDAC1 and deacetylation of histones at the promoter. Analysis of INI1/hSNF5 truncations indicated that cyclin D1 repression and flat cell formation are tightly correlated. Coexpression of cyclin D1 from a heterologous promoter in MON was sufficient to eliminate the INI1-mediated flat cell formation and cell cycle arrest. Furthermore, cyclin D1 was overexpressed in AT/RT tumors. Our data suggest that one of the mechanisms by which INI1/hSNF5 exerts its tumor suppressor function is by mediating the cell cycle arrest due to the direct recruitment of HDAC activity to the cyclin D1 promoter thereby causing its repression and G(0)-G(1) arrest. Repression of cyclin D1 gene expression may serve as a useful strategy to treat AT/RT.


Figures

FIG. 1.
FIG. 1.
Flat cell induction by INI1/hSNF5 in MON cells. (A) Phase-contrast microscopy of MON cells transfected with pEAC001 (expressing INI1/hSNF5 [right-hand panel]) or pUHD10.3 (empty vector [left-hand panel]) along with pTet-On vector after 15 days of selection in neomycin. Both the images were taken at a magnification of ×20 (shown here at ×16). (B and C) Immunoblot analysis of total protein isolated from MON cells. (B) Proteins isolated from MON after 4 days of transfection; (C) results of analysis after 15 days. Dox., doxycycline.
FIG. 2.
FIG. 2.
FACS analysis of MON cells transfected with INI1/hSNF5. MON cells were analyzed by FACS 7 days after transfection. The plasmids used in the transfection are indicated at the top of the panels. They are pCGN-INI1, which is the HA-INI1/hSNF5 expression plasmid, and pCGN, which is the empty vector control. The diagram represents the relative cell number in 2n and 4n channels. The actual percentage of cells in each stage of the cell cycle is presented in Table 2.
FIG.3.
FIG.3.
Repression of cyclin D1 transcription by INI1/hSNF5. (A) Schematic representation of regulatory region in cyclin D1 promoter. (B) INI1/hSNF5 represses transcription from the cyclin D1 promoter. Top panel depicts the graphic representation of transcriptional activity. Relative light units per microgram of protein were measured and normalized to the percentage of transfection efficiency determined by using GFP. Results are averages of three independent experiments and are expressed as percent maximal activity. Error bars, standard deviations. The lower panel shows an immunoblot analysis of the lysates used in these experiments using α-HA antibody. (C) Repression of cyclin E and cyclin A promoters by INI1/hSNF5. The indicated reporter plasmids were cotransfected with INI1 expressing plasmids and the transcriptional activity was determined as above. (D) Repression of endogenous cyclin D1 by INI1/hSNF5 in MON cells. The diagram depicts the ethidium bromide-stained gel of DNA obtained from the reverse transcription-PCR analysis. RNA isolated from MON cells transfected either with pCGN-INI1 (expressing HA-INI1/hSNF5) or pCGN (empty vector) was subjected to reverse transcription-PCR. The top panel represents the reverse transcription-PCR products obtained using primers specific to cyclin D1 gene. The bottom panel represents reverse transcription-PCR products using primers specific to the GAPDH gene as internal control. The numbers on top of the gel correspond to the amount of RNA template used for the reverse transcription-PCR.
FIG. 4.
FIG. 4.
INI1/hSNF5 represses cyclin D1 by recruiting HDAC activity to the promoter. (A) Coimmunoprecipitation of HDAC1 with INI1 and its truncation. Plasmids expressing either GFP, GFP-INI1, or GFP-ΔINI1Δ(259-385) were transfected into MON cells and immunoprecipitated using α-GFP antibody. The resulting immunoprecipitates were separated on sodium dodecyl sulfate-polyacrylamide gel electrophoresis and immunoblotted using α-HDAC1 antibody. “Lysate” represents equal amount of proteins from the input (lanes 1 to 3). Lanes 4 to 9 represent the immunoblot analysis of the immunoprecipitates obtained using either α-GFP antibody or a control α-6H antibody. (B) Immunoblot analysis of MON cells transfected with indicated plasmids using α-GFP antibody to demonstrate the level of proteins expressed. (C) The effect of GFP-fusions of INI1/hSNF5 and the truncation on the cyclin D1 promoter. Relative light units per microgram of protein present in the lysates from the above transfection were measured and normalized to the percentage of transfection efficiency determined by using GFP fluorescence. Results are averages of three independent experiments and are expressed as percent maximal activity. Error bars, standard deviations. (D) ChIP analysis of cyclin D1 promoter in the presence of INI1/hSNF5. MON cells were transfected with either pCGN (empty vector) or pCGN-INI1 (expressing HA-INI1) and pCD1-Luc. ChIP analysis was performed using α-INI1, preimmune serum, α-HDAC1, and α-acetyl-histone H4 antibodies. The immunoprecipitated DNA was subjected to PCR amplification using the primers specific to cyclin D1 promoter (top panel) or a downstream region (bottom panel). The picture represents agarose gel electrophoretic separation of DNA obtained in these PCRs. A fivefold serial dilution of input DNA has been loaded for each sample.
FIG. 5.
FIG. 5.
Repression of cyclin D1 by INI1/hSNF5 is correlated with its ability to cause flat cells. (A) Truncations of INI1/hSNF5 used to test the effect on cyclin D1 expression and flat cell formation. Rpt, repeat. The numbers below the bar represent the amino acid number of the INI1 portion. (B) Repression of cyclin D1 by INI1 and its truncations. Cells transfected with indicated plasmids were harvested, the total proteins were isolated and subjected to luciferase assay as described. Relative light units/μg proteins were measured and normalized to the percentage of transfection efficiency determined by using GFP. Results are averages of three independent experiments and are expressed as percent maximal activity. (C) Percentage flat cells obtained by transfecting various truncations of INI1/hSNF5. The data represents average of three independent experiments. (D) Immunoblot analysis of the cell lysates used in the above experiments using monoclonal α-HA antibody (Courtesy of S. Buhl, Albert Einstein College of Medicine). Stars in the picture indicate the bands corresponding to the expected size of INI1 and truncations.
FIG. 6.
FIG. 6.
Reversal of INI1/hSNF5-mediated flat cell formation by ectopic expression of cyclin D1. (A) Phase-contrast micrographs of MON cells expressing INI1 and cyclin D1. The first panel illustrates MON cells transfected with pRc-CMV and pCGN (empty vectors), the second panel illustrates MON cells transfected with pRc-CMV-CD1 (expressing cyclin D1) and pCGN, the third panel illustrates cells transfected with pCGN-INI1 (expressing HA-INI1/hSNF5) and pRc-CMV (empty vector), and the fourth panel illustrates the MON cells transfected with pRc-CMV-CD1 and pCGN-INI1. (B) Effect of INI1 and cyclin D1 on the colony numbers. MON cells were transfected with plasmids expressing indicated proteins. Cells were maintained under neomycin selection for 15 days prior to staining with trypan blue. (C) Graphical representation of colony counts in the presence and absence of cyclin D1 and INI1/hSNF5. The colonies were fixed with 2% paraformaldehyde, stained with 0.4% trypan blue, and counted, and results were expressed as percentages. Colonies obtained with empty vector control were taken as 100%. Note that expression of cyclin D1 overcomes the inhibitory effect of INI1 on colony formation in MON cells. (D) Cyclin D1 expression does not alter the expression of INI1/hSNF5. The photograph represents the immunoblot analysis of MON cells expressing INI1/hSNF5 and Cyclin D1. Total proteins were analyzed by sequential immunoblotting using α-INI1, α-cyclin D1 and α-tubulin antibodies.
FIG. 7.
FIG. 7.
(A) INI1/hSNF5-mediated repression of cyclin D1 is independent of Rb family function. Increasing concentrations of plasmid pE1a-12S (expressing E1A-12S, an inhibitor of Rb family) were cotransfected with INI1/hSNF5 into MON cells. The transcription was assayed as before, and the results are expressed as relative light units (RLU) per microgram of protein. (B) Cyclin D1 is overexpressed in AT/RT tumor samples. The diagram represents immunohistochemical analysis of AT/RT tumors for expression of cyclin D1. (a and b)Paraffin section of brain tissue adjacent (BAT) to AT/RT tumor, 958406. (c to h) Paraffin sections of three different AT/RT tumors. The left panels represent hematoxylin and eosin (H&E) staining of the sections to demonstrate the nuclei. The right panels represent immunohistochemical analysis using α-cyclin D1 antibody. The arrows in panels c to h represent random nuclei. The positive signal in panel b represents a rare immunoreactive nucleus in the filed, probably from an astrocyte.
FIG. 7.
FIG. 7.
(A) INI1/hSNF5-mediated repression of cyclin D1 is independent of Rb family function. Increasing concentrations of plasmid pE1a-12S (expressing E1A-12S, an inhibitor of Rb family) were cotransfected with INI1/hSNF5 into MON cells. The transcription was assayed as before, and the results are expressed as relative light units (RLU) per microgram of protein. (B) Cyclin D1 is overexpressed in AT/RT tumor samples. The diagram represents immunohistochemical analysis of AT/RT tumors for expression of cyclin D1. (a and b)Paraffin section of brain tissue adjacent (BAT) to AT/RT tumor, 958406. (c to h) Paraffin sections of three different AT/RT tumors. The left panels represent hematoxylin and eosin (H&E) staining of the sections to demonstrate the nuclei. The right panels represent immunohistochemical analysis using α-cyclin D1 antibody. The arrows in panels c to h represent random nuclei. The positive signal in panel b represents a rare immunoreactive nucleus in the filed, probably from an astrocyte.

Similar articles

Cited by

References

    1. Adler, H. T., R. Chinery, D. Y. Wu, S. J. Kussick, J. M. Payne, A. J. Fornace, Jr., and D. C. Tkachuk. 1999. Leukemic HRX fusion proteins inhibit GADD34-induced apoptosis and associate with the GADD34 and hSNF5/INI1 protein. Mol. Cell. Biol. 19:7050-7060. - PMC - PubMed
    1. Albanese, C., M. D'Amico, A. T. Reutens, M. Fu, G. Watanabe, R. J. Lee, R. N. Kitsis, B. Henglein, M. Avantaggiati, K. Somasundarum, B. Thimmapaya, and R. G. Pestell. 1999. Activation of the cyclinD1 gene by the E1a associated protein p300 through AP-1 inhibits cellular apoptosis. J. Biol. Chem. 274:34186-34195. - PubMed
    1. Biegel, J. A., C. S. Allen, K. Kawasaki, N. Shimizu, M. L. Budarf, and C. J. Bell. 1996. Narrowing the critical region for a rhabdoid tumor locus in 22q11. Genes Chromosomes Cancer 16:94-105. - PubMed
    1. Biegel, J. A., J. Y. Zhou, L. B. Rorke, C. Stenstrom, L. M. Wainwright, and B. Fogelgren. 1999. Germ-line and acquired mutations of INI1 in atypical teratoid and rhabdoid tumors. Cancer Res. 59:74-79. - PubMed
    1. Carlson, M., and B. C. Laurent. 1994. The SNF/SWI family of global transcriptional activators. Curr. Opin. Cell Biol. 6:396-402. - PubMed

Publication types

MeSH terms

LinkOut - more resources