Features of stimulation affecting tonal-speech perception: implications for cochlear prostheses
- PMID: 12141350
- PMCID: PMC1414789
- DOI: 10.1121/1.1487843
Features of stimulation affecting tonal-speech perception: implications for cochlear prostheses
Abstract
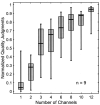
Tone languages differ from English in that the pitch pattern of a single-syllable word conveys lexical meaning. In the present study, dependence of tonal-speech perception on features of the stimulation was examined using an acoustic simulation of a CIS-type speech-processing strategy for cochlear prostheses. Contributions of spectral features of the speech signals were assessed by varying the number of filter bands, while contributions of temporal envelope features were assessed by varying the low-pass cutoff frequency used for extracting the amplitude envelopes. Ten normal-hearing native Mandarin Chinese speakers were tested. When the low-pass cutoff frequency was fixed at 512 Hz, consonant, vowel, and sentence recognition improved as a function of the number of channels and reached plateau at 4 to 6 channels. Subjective judgments of sound quality continued to improve as the number of channels increased to 12, the highest number tested. Tone recognition, i.e., recognition of the four Mandarin tone patterns, depended on both the number of channels and the low-pass cutoff frequency. The trade-off between the temporal and spectral cues for tone recognition indicates that temporal cues can compensate for diminished spectral cues for tone recognition and vice versa. An additional tone recognition experiment using syllables of equal duration showed a marked decrease in performance, indicating that duration cues contribute to tone recognition. A third experiment showed that recognition of processed FM patterns that mimic Mandarin tone patterns was poor when temporal envelope and duration cues were removed.
Figures


Similar articles
-
Human Frequency Following Responses to Vocoded Speech.Ear Hear. 2017 Sep/Oct;38(5):e256-e267. doi: 10.1097/AUD.0000000000000432. Ear Hear. 2017. PMID: 28362674 Free PMC article.
-
Spectral and temporal cues in cochlear implant speech perception.Ear Hear. 2006 Apr;27(2):208-17. doi: 10.1097/01.aud.0000202312.31837.25. Ear Hear. 2006. PMID: 16518146
-
Spectral and temporal cues for speech recognition: implications for auditory prostheses.Hear Res. 2008 Aug;242(1-2):132-40. doi: 10.1016/j.heares.2007.12.010. Epub 2007 Dec 28. Hear Res. 2008. PMID: 18249077 Free PMC article.
-
Reverberation Degrades Pitch Perception but Not Mandarin Tone and Vowel Recognition of Cochlear Implant Users.Ear Hear. 2022 Jul-Aug 01;43(4):1139-1150. doi: 10.1097/AUD.0000000000001173. Epub 2021 Nov 12. Ear Hear. 2022. PMID: 34799495
-
The effectiveness of sound-processing strategies on tonal language cochlear implant users: A systematic review.Pediatr Investig. 2017 Dec 27;1(1):32-39. doi: 10.1002/ped4.12011. eCollection 2017 Dec. Pediatr Investig. 2017. PMID: 32851216 Free PMC article. Review.
Cited by
-
Relative Contributions of Spectral and Temporal Cues to Korean Phoneme Recognition.PLoS One. 2015 Jul 10;10(7):e0131807. doi: 10.1371/journal.pone.0131807. eCollection 2015. PLoS One. 2015. PMID: 26162017 Free PMC article.
-
Across-site patterns of modulation detection: relation to speech recognition.J Acoust Soc Am. 2012 May;131(5):4030-41. doi: 10.1121/1.3701879. J Acoust Soc Am. 2012. PMID: 22559376 Free PMC article. Clinical Trial.
-
Cantonese Tone Identification in Three Temporal Cues in Quiet, Speech-Shaped Noise and Two-Talker Babble.Front Psychol. 2018 Oct 9;9:1604. doi: 10.3389/fpsyg.2018.01604. eCollection 2018. Front Psychol. 2018. PMID: 30356874 Free PMC article.
-
Age-Related Changes in Voice Emotion Recognition by Postlingually Deafened Listeners With Cochlear Implants.Ear Hear. 2022 Mar/Apr;43(2):323-334. doi: 10.1097/AUD.0000000000001095. Ear Hear. 2022. PMID: 34406157 Free PMC article.
-
Speech recognition and temporal amplitude modulation processing by Mandarin-speaking cochlear implant users.Ear Hear. 2008 Dec;29(6):957-70. doi: 10.1097/AUD.0b013e3181888f61. Ear Hear. 2008. PMID: 18818548 Free PMC article.
References
-
- Cochlear Corporation . Lane Cove. Cochlear Limited; Australia: 1999. Nucleus Technical Reference Manual Z43470 Issue 1.
-
- Dorman MF, Loizou PC. “The identification of consonants and vowels by cochlear implant patients using a 6-channel continuous interleaved sampling processor and by normal-hearing subjects using simulations of processors with two to nine channels,”. Ear Hear. 1998;19:162–166. - PubMed
-
- Dorman MF, Loizou PC, Fitzke J, Tu Z. “The recognition of sentences in noise by normal-hearing listeners using simulations of cochlear-implant signal processors with 6-20 channels,”. J. Acoust. Soc. Am. 1998;104:3583–3596. - PubMed
-
- Dorman MF, Loizou PC, Rainey D. “Speech intelligibility as a function of the number of channels of stimulation for signal processors using sine-wave and noise outputs,”. J. Acoust. Soc. Am. 1997a;102:2403–2411. - PubMed
-
- Dorman MF, Loizou PC, Rainey D. “Simulating the effect of cochlear-implant electrode insertion depth on speech understanding,”. J. Acoust. Soc. Am. 1997b;102:2993–2996. - PubMed
Publication types
MeSH terms
Grants and funding
LinkOut - more resources
Full Text Sources
Medical

