

Alcohol consumption and mortality: modelling risks for men and women at different ages
- PMID: 12142306
- PMCID: PMC117446
- DOI: 10.1136/bmj.325.7357.191
Alcohol consumption and mortality: modelling risks for men and women at different ages
Abstract
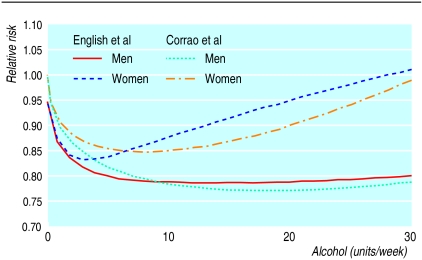
Objective: To estimate the relation between alcohol consumption and risk of death, the level of alcohol consumption at which risk is least, and how these vary with age and sex.
Design: Analysis using published systematic reviews and population data.
Setting: England and Wales in 1997.
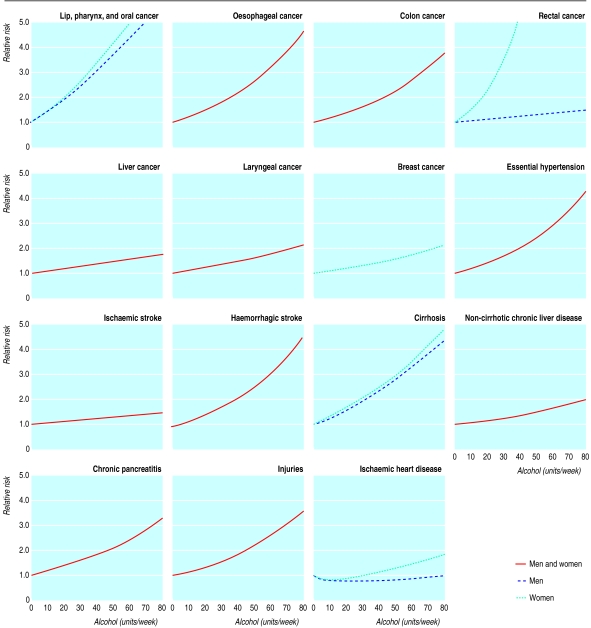
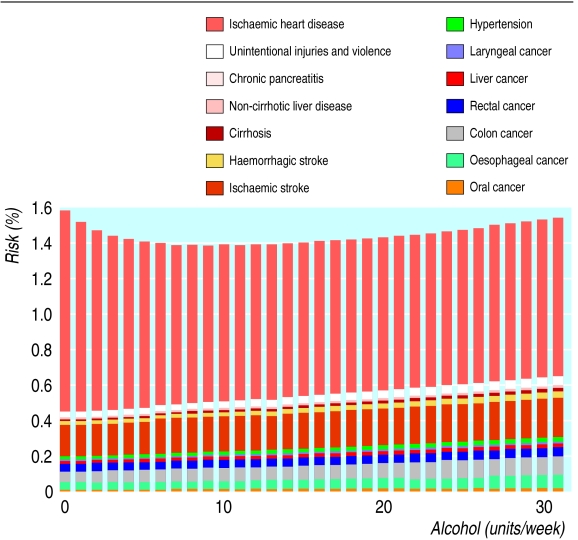
Main outcome measures: Death from any of the following causes: cancer of lip, oral cavity, pharynx, oesophagus, colon, rectum, liver, larynx, and breast, essential hypertension, coronary heart disease, stroke, cirrhosis, non-cirrhotic chronic liver disease, chronic pancreatitis, and injuries.
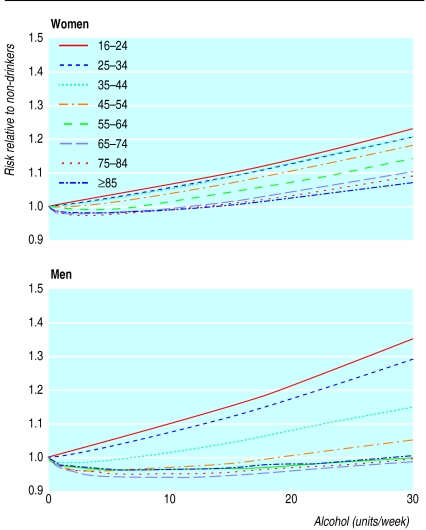
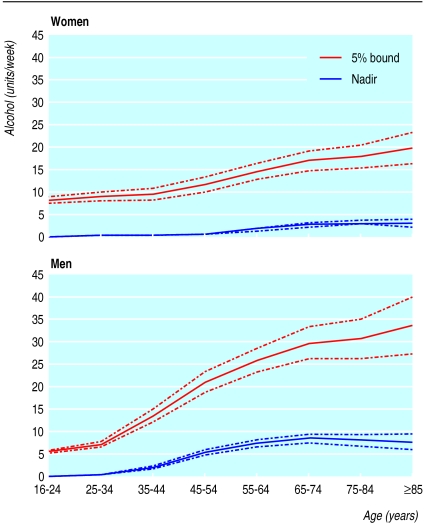
Results: A direct dose-response relation exists between alcohol consumption and risk of death in women aged 16-54 and in men aged 16-34. At older ages the relation is U shaped. The level at which the risk is lowest increases with age, reaching 3 units a week in women aged over 65 and 8 units a week in men aged over 65. The level at which the risk is increased by 5% above this minimum is 8 units a week in women aged 16-24 and 5 units a week in men aged 16-24, increasing to 20 and 34 units a week in women and men aged over 65, respectively.
Conclusions: Substantially increased risks of all cause mortality can occur even in people drinking lower than recommended limits, and especially among younger people.
Figures
Comment in
-
Alcohol and death: the New Zealand experience.BMJ. 2002 Oct 19;325(7369):904. doi: 10.1136/bmj.325.7369.904. BMJ. 2002. PMID: 12386053 Free PMC article. No abstract available.
References
-
- English DR, Holman CDJ, Milne E, Winter MG, Hulse GK, Codde JP, et al. The quantification of drug caused morbidity and mortality in Australia 1995. Canberra: Commonwealth Department of Human Services and Health; 1995.
-
- Anderson P, Cremona A, Paton A, Turner C, Wallace P. The risk of alcohol. Addiction. 1993;88:1493–1508. - PubMed
-
- Maclure M. Demonstration of deductive meta-analysis: ethanol intake and risk of myocardial infarction. Epidemiol Rev. 1993;15:328–351. - PubMed
-
- Klatsky AL. Epidemiology of coronary heart disease—influence of alcohol. Alcohol Clin Exp Res. 1994;18:88–96. - PubMed
Publication types
MeSH terms
LinkOut - more resources
Full Text Sources
Medical